Salon
Bir topluluğun dağılımı
Bir topluluğa ait çok sayıda ölçüm: çoğunun nerede toplandığı, kalanların ne kadar uzağa yayıldığı. Buradaki biçimler tek bir üyeyi değil, topluluğun dağılımını gösterir.
Bizim yeniden çizdiğimiz 2
Schemes of distribution drawn in opposed directions
Francis Galton · 1889
İki topluluk ortak bir yüzdelik dilim ekseni üzerinde karşılıklı çizildiği için eğrileri bir kez kesişir.
Cumulative interval blocks with a within-interval diagonal
Robert E. Chaddock · 1921
Özgün sayfasından incelendi 9
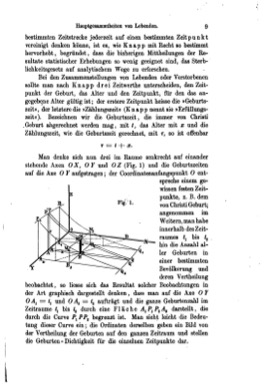
Knapp's translated generating-curve construction
Georg Friedrich Knapp · 1868
Zeuner three-dimensional frequency surface
Gustav Zeuner · 1869
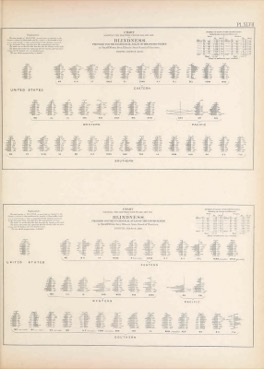
Walker's population pyramid
Frederick H. Wines, in Walker's Statistical Atlas · 1874
Galton ogive
Francis Galton · 1875
Ölçülmemiş ama sıraya dizilmiş şeyler: her biri sıradaki yerinde durur, çizimde yalnızca çeyrek, orta ve üç çeyrek noktalarındaki yükseklikler yer alır.
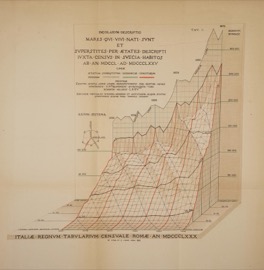
Perozzo stereogram
Luigi Perozzo · 1880
Pilot-chart wind rose
US Navy Hydrographic Office · 1883
Regression on grades drawn under two interval assumptions
Karl Pearson and David Heron · 1913
Radial price-zone disc
Arthur R. Burns (source: Federal Trade Commission, Price Bases Inquiry) · 1936
Volumetric temperature-salinity diagram
R. B. Montgomery · 1958
Kataloglandı 90
- Clay accounting tokens Neolithic Fertile Crescent peoples · 8000 BCE
- Pebble voting Athenian democratic practice · 500 BCE
- Codex Mendoza tribute list Nahua tlacuilo scribes at Tlatelolco, for Viceroy Antonio de Mendoza · 1541
- Van Langren's longitude graph Michael F. van Langren · 1644
- Huygens' life-expectancy curve Christiaan Huygens · 1669
- Bayes density curve Thomas Bayes · 1763
- Fourcroy tableau poleometrique Charles de Fourcroy · 1782
- Kupe tally bundle Torres Strait Islanders · 1800s
- Wind rose (statistical) Various; standardised in the 20th century · 1800s
- Fourier cumulative frequency curve Jean Baptiste Joseph Fourier · 1821
- Great Exhibition gold obelisk Great Exhibition displays, Crystal Palace · 1851
- Baseball box score Henry Chadwick · 1859
- Radar (star) diagram Georg von Mayr · 1877
- Composite portraiture Francis Galton · 1878
- Parallel coordinates Maurice d'Ocagne; Alfred Inselberg · 1885/1985
- Galton's bivariate isolines Francis Galton · 1886
- Hypsographic curve John Murray (1888); Erwin Kossinna (modern form) · 1888-1933
- Galton board Francis Galton · 1893
- Kardex visible record system James H. Rand Sr. (visible index); James Rand Jr. (Kardex brand) · 1898-1915
- Flow-duration curve US hydrologic practice; no single originator · 1900s
- Load-duration curve Electric utility planning practice; no single originator · 1900s
- Pearson-Lee bivariate histogram model Karl Pearson and Alice Lee · 1900
- Davenport physical distribution Charles Benedict Davenport · 1901
- Stereonet (Wulff and Schmidt nets) G. Wulff; W. Schmidt · 1902/1925
- Lorenz curve Max Otto Lorenz · 1905
- Harker variation diagram Alfred Harker · 1909
- Hertzsprung-Russell diagram Hertzsprung; Russell · 1911/1913
- Hazen probability paper Allen Hazen · 1914
- Normal probability paper Allen Hazen · 1914
- Isotype pictorial statistics Otto & Marie Neurath, Gerd Arntz · 1925+
- Hubble diagram Edwin Hubble · 1929
- Rosin-Rammler paper Paul Rosin and Erich Rammler · 1933
- Gumbel probability paper Emil Julius Gumbel · 1941
- Pareto chart Joseph Moses Juran · 1941-1951
- Survivorship curve Edward Smith Deevey Jr. · 1947
- Binomial probability paper Mosteller & Tukey · 1949
- Multi-vari chart Leonard Seder · 1950
- Van Krevelen diagram D.W. van Krevelen · 1950
- Weibull probability paper Waloddi Weibull · 1951
- Formant chart Gordon Edward Peterson and Harold Leonard Barney · 1952
- Range bar chart Mary Eleanor Spear · 1952
- Dalitz plot Richard Dalitz · 1953
- Range (floating bar) chart No single inventor documented; classified by Calvin F. Schmid · 1954
- Wilcox / US Salinity Lab diagram Richards (USDA Handbook 60); Wilcox · 1954-1955
- Metroglyphs Edgar Anderson · 1957/1960
- Passega C-M diagram Renato Passega · 1957
- Half-normal plot Cuthbert Daniel · 1959
- Kamb contouring William Barclay Kamb · 1959
- Youden plot W.J. Youden · 1959
- P-P plot No single documented originator · 1960s-1970s
- Pollution rose Air pollution meteorology practice · 1960s
- Chew-Frautschi plot Geoffrey F. Chew and Steven C. Frautschi · 1961
- Paleocurrent rose diagram Paul Edwin Potter and Francis John Pettijohn (synthesis) · 1963
- Ramachandran plot G.N. Ramachandran · 1963
- Rank-abundance plot Robert Harding Whittaker · 1965
- Graphical rational patterns Roberto Bachi · 1968
- Q-Q plot Martin Bradbury Wilk and Ramanathan Gnanadesikan · 1968
- Coekin polygon display J. A. Coekin · 1969
- Visher grain-size probability plot Glenn Spaulding Visher · 1969
- Forest plot Gradual; no single documented originator · 1970s-1980s
- GE-McKinsey nine-box matrix McKinsey and Company for General Electric; no individual documented · 1970s
- Gibbs water-chemistry diagram Ronald J. Gibbs · 1970
- Growth-share matrix Bruce Doolin Henderson; first sketch credited to Alan Zakon · 1970
- Participatory ballot-box bar chart Hans Haacke · 1970
- Biplot Karl Ruben Gabriel · 1971
- Andrews curves David F. Andrews · 1972
- Hazard paper (hazard plotting) Wayne Nelson · 1972
- Suspended (hanging) rootogram John Wilder Tukey · 1972
- Chernoff faces Herman Chernoff · 1973
- Correspondence analysis map Jean-Paul Benzecri · 1973
- Weathervane plot Attribution unverified · 1974
- Back-to-back stem-and-leaf display John Wilder Tukey · 1977
- Dot-box tally John W. Tukey · 1977
- Stem-and-leaf display John W. Tukey · 1977
- Notched box plot Robert McGill, John Wilder Tukey and Wayne A. Larsen · 1978
- Association plot Ayala Cohen; extended by Michael Friendly · 1980
- Scatterplot matrix (draftsman's display) John Wilder Tukey and Paul A. Tukey · 1981
- Trees and castles Kleiner & Hartigan · 1981
- Letter-value display David Caster Hoaglin · 1983
- Sieve diagram Riedwyl & Schüpbach · 1983
- Funnel plot Richard J. Light and David B. Pillemer · 1984
- Market Profile J. Peter Steidlmayer · 1984-1985
- Sunflower plot William Swain Cleveland and Robert McGill · 1984
- Bland-Altman plot John Martin Bland and Douglas Graham Altman · 1986
- L'Abbe plot Kristan A. L'Abbe, Allan S. Detsky and Keith O'Rourke · 1987
- Galbraith radial plot Rex F. Galbraith · 1988
- Ashby material selection chart Michael Farries Ashby · 1989
- Fourfold display Michael Friendly · 1994
- Five-bar gate tally Anonymous; European counting practice · folk convention
- Zheng character tally Anonymous; East Asian counting practice · folk convention
Şu salonda da yer alabilirdi: Bir topluluğun dağılımı 34
- Hipparchus magnitude star catalogue Hipparchus of Nicaea · 134 BCE
- Crome's area comparisons August F.W. Crome · 1782/1785
- Polar coordinate paper Various · 1800s
- Playfair's circle diagrams with tangent lines William Playfair · 1801
- Von Mayr rectangular (proto-mosaic) diagrams Georg von Mayr · 1877
- Scribner Statistical Atlas of the United States Fletcher Willis Hewes and Henry Gannett · 1883
- Rank charts of states Henry Gannett · 1898
- Seyler coal classification chart Clarence Arthur Seyler · 1900
- Wind barb International meteorological practice · 1900s
- Yamazumi chart Toyota Production System; no individual originator documented · 20th century
- Raunkiær life-form spectrum Christen Christiansen Raunkiær · 1905
- Pearson beta1-beta2 chart Charles Rhind (chart form); Karl Pearson (adopted) · 1909-1916
- T-S (temperature-salinity) diagram Bjørn Helland-Hansen · 1916
- Volumetric chart (solid model) Statistical model-making practice; described by Karsten · 1923
- Partial residual plot Mordecai Joseph Brill Ezekiel · 1924
- Thorndike chart Frances Thorndike · 1926
- Operating characteristic (OC) curve Harold Dodge and Harry Romig · 1929-1944
- Intensity-duration-frequency curves Charles W. Sherman · 1931
- Forest profile diagram Thomas Albert Warren Davis and Paul Westmacott Richards · 1933
- Clopper-Pearson confidence belts Clopper & Pearson · 1934
- Probit plot Chester Ittner Bliss · 1934
- Target sociogram Mary Northway · 1940
- MMPI profile sheet Starke Rosecrans Hathaway and John Charnley McKinley · 1943
- Scalogram board Louis Guttman; E.A. Suchman · 1944/1950
- Microtiter plate Gyula Takatsy · 1951
- Bilateral deviation bar chart No single inventor documented; classified by Calvin F. Schmid · 1954
- Pre-control chart Frank Edward Satterthwaite, Rath and Strong · 1954
- Repertory grid George Kelly · 1955
- Interpersonal circumplex Timothy Leary · 1957
- Semantic differential profile Charles Osgood · 1957
- Givoni building bioclimatic chart Baruch Givoni · 1969
- Kiviat graph Philip J. Kiviat; named by Kenneth W. Kolence · 1973
- Resistant line John Wilder Tukey · 1977
- TAS (total alkali-silica) diagram Maurice John Le Bas, Roger Walter Le Maitre, Albert Streckeisen and Bruno Zanettin · 1986