Salon
Zaman içinde değişim
Yıllar, saatler ya da tek yönde ilerleyen herhangi bir ölçek boyunca sıralanmış değerler. Buradaki biçimler, değerin sıra ilerledikçe nasıl değiştiğini gösterir.
Bizim yeniden çizdiğimiz 1
Diagramme planétaire
Émile Cheysson, Ministère des Travaux publics (Album de statistique graphique) · 1897
Fransa'da taşınan mallar gösterilir: merkezin çevresindeki her ışın dört yıllık bir dönemi, sarmal üzerindeki dairelerin büyüklüğü ise ton cinsinden taşınan miktarı gösterir.
Özgün sayfasından incelendi 18
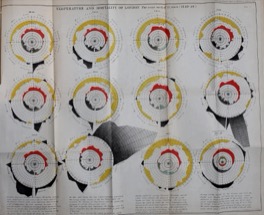
Farr circular mortality diagram
William Farr · 1852
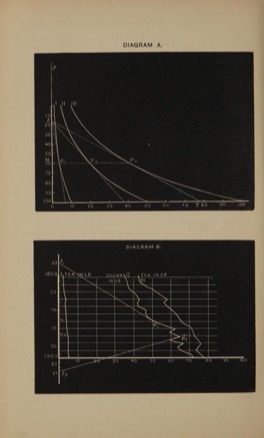
Semi-logarithmic (ratio) chart
William Stanley Jevons; codified by Irving Fisher · 1863
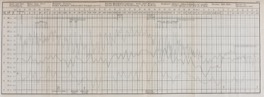
Clinical temperature chart
Carl Wunderlich · 1868
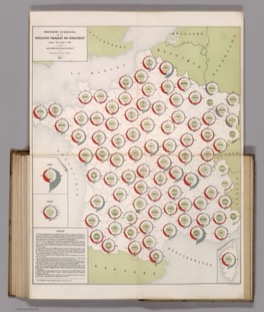
Polar deviation ring
Ministère des Travaux Publics, Direction des Cartes et Plans (Album de statistique graphique, directed by Émile Cheysson) · 1883
Standard-gauge historical-curve atlas
Alfred Marshall · 1885
Lag determination by superimposed tracings
Willard C. Brinton (given as working practice) · 1914
Climograph (hythergraph)
Griffith Taylor · 1915-1916
Bir yerin on iki ayı, yaş termometre sıcaklığı ile nem arasındaki ilişkiyi gösteren tek bir kapalı halka olarak çizilir.
Graphical string-lining chart
H. M. Church, Division Engineer, Baltimore & Ohio Railroad, Baltimore · 1915
Logarithmic retrospect chart
Karl G. Karsten · 1923
Silhouette bar-chart
Karl G. Karsten (name and account); his examples draw on the Survey of Current Business, and one is credited to Carl Snyder · 1923
Stüve diagram (pseudo-adiabatic chart)
Georg Stüve · 1927
Rossby diagram
C.-G. Rossby · 1932
Hjulström curve
Filip Hjulström · 1935
Identified units under a middle-half band
Works Progress Administration, Division of Social Research · 1937
Bartels musical diagram
Julius Bartels (with N. H. Heck and H. F. Johnston) · 1939
The Wetzel Grid
Norman C. Wetzel · 1941
Thermoisopleth diagram
Carl Troll · 1943
Ombrothermic diagram
Henri Gaussen and Fernand Bagnouls · 1953-1957
Kataloglandı 153
- Ishango bone Upper Palaeolithic maker, Ishango region · 20000 BCE
- Analemma Vitruvius (term); figure-of-eight form 18th century · 1st century BC - 18th century
- Tenth-century planetary latitude graph Anonymous scribe, Macrobius commentary manuscript · 950-1000
- Diastematic (heighted) neumes Beneventan and Aquitanian scribes; no individual credited · 1000-1050
- Fu Xi circular hexagram arrangement Formalised by Shao Yong; traditionally attributed to Fu Xi · 11th century
- Guidonian hand Guido of Arezzo (attributed); drawn form from the 12th century · 1025-1200
- al-Biruni lunar phase diagrams Abu Rayhan al-Biruni · 1029
- Latitude of forms Nicole Oresme · 1350
- Lute tablature German tablature traditionally credited to Conrad Paumann · 1400s-1511
- Traverse board Traditional nautical practice; no single originator · 1571 or earlier
- Stratigraphic column No single originator; conceptual basis Nicolaus Steno (1669) · 1600s-1800s
- Sunspot drawing sequence Galileo Galilei · 1613
- Change-ringing method lines Fabian Stedman · 1668/1677
- Beauchamp-Feuillet notation Pierre Beauchamp (system); Raoul-Auger Feuillet (published) · 1700
- Candlestick chart Traditionally Munehisa Homma (unverified); introduced to the West by Steve Nison · 18th century - 1991
- Physical spline and ducks Shipbuilding and lofting practice · 1750
- Lambert experimental graph Johann Heinrich Lambert · 1765-1779
- Balance-of-trade chart William Playfair · 1786
- Printed coordinate (squared) paper Buxton (patent) · 1794
- GZ curve and cross curves of stability George Atwood (righting arm); later naval architecture practice · 1796-1900s
- Indicator diagram James Watt; John Southern · 1796
- Cam displacement diagram Machine-design practice; no single originator · 1800s-1900s
- Cobweb plot Attribution contested (Lemeray; Verhulst; Legendre) · 1800s-1900s
- Kagi, renko and three-line-break charts Japanese traders; Nison 1994 · 19th-20th c.
- Polar coordinate paper Various · 1800s
- Goethe colour circle Johann Wolfgang von Goethe · 1810
- Fraunhofer spectrum map Joseph von Fraunhofer · 1814-1815
- Playfair wheat and wages chart William Playfair · 1821
- Graphical orbit smoothing for double stars John Frederick William Herschel · 1833
- Chevreul chromatic circle Michel Eugène Chevreul · 1839
- Kymograph trace Carl Ludwig · 1847
- Lissajous figure Jules Antoine Lissajous (Nathaniel Bowditch, 1815) · 1857
- Phonautograph trace Édouard-Léon Scott de Martinville · 1857
- Polar area diagram (coxcomb) Florence Nightingale · 1858
- Sphygmogram Étienne-Jules Marey · 1859
- Shear and bending-moment diagram Out of the Culmann and Mohr graphic-statics tradition · 1860s
- Jevons logarithmic price chart William Stanley Jevons · 1862-1863
- Telluric screw (vis tellurique) A.-E. B. de Chancourtois · 1862
- Law of octaves table John Alexander Reina Newlands · 1865
- Kundt's tube August Kundt · 1866
- Hinrichs spiral periodic system Gustavus Detlef Hinrichs · 1867
- Influence line Emil Winkler and Christian Otto Mohr (independently) · 1867-1868
- Visible Speech notation Alexander Melville Bell · 1867
- Andrews carbon dioxide isotherms Thomas Andrews · 1869
- Mendeleev periodic table Dmitri Ivanovich Mendeleev · 1869
- Atomic-volume curve Lothar Meyer · 1870
- Baumhauer spiral periodic system Heinrich Adolph Baumhauer · 1870
- Mass-haul (Brückner) diagram Brückner (attrib.) · 1870s
- S-N (Wohler) curve August Wöhler · 1870
- Muybridge motion sequence Eadweard Muybridge · 1878
- Galton number form Francis Galton · 1880-1881
- Message stick Aboriginal Australian peoples, many language groups · pre-contact; documented from 1880s
- Point-and-figure chart Tape readers; de Villiers 1933 · 1880s-1933
- Winogradsky column Sergei Nikolaievich Winogradsky · 1880
- Bayley pyramid periodic table Thomas Bayley · 1882
- Geometric chronophotography Étienne-Jules Marey · 1882-1890s
- Piano roll Emil Welte · 1883
- Rippl mass curve Wenzel Rippl · 1883
- Emagram After Hertz; named by Refsdal · 1884-1930
- Marey movement sculpture Etienne-Jules Marey · 1887
- Crookes lemniscate periodic system William Crookes · 1888
- Lilienthal polar diagram Otto Lilienthal · 1889
- Stepanov dance notation Vladimir Ivanovich Stepanov · 1892
- Anaesthesia record (ether chart) Harvey Cushing; Ernest Codman · 1894
- Seismic travel-time curve Richard Dixon Oldham (empirical); Karl Zoeppritz (theoretical) · 1897-1907
- Crookes vis generatrix model William Crookes, built by Gardiner · 1898
- Rank charts of states Henry Gannett · 1898
- Pressure-volume loop Otto Frank · 1899
- Chemograph Hydrochemistry practice; no single originator · 1900s
- Du Bois spiral bar chart W.E.B. Du Bois and students · 1900
- Hyetograph Hydrologic practice; no single originator · 1900s
- Kite diagram Field ecology practice · 20th c.
- Neuhoff pseudo-adiabatic chart Otto Neuhoff · 1900
- Seismic record section Exploration seismology practice; no single originator · 1900s
- Rubens tube Heinrich Rubens · 1905
- Varve diagram Gerard Jacob De Geer · 1912
- Genetic linkage map Alfred Henry Sturtevant · 1913
- Tephigram Napier Shaw · 1915
- Wiggers diagram Carl J. Wiggers · 1915
- Wire motion-path model Frank Bunker Gilbreth · 1915
- Pollen diagram Lennart von Post · 1916
- T-S (temperature-salinity) diagram Bjørn Helland-Hansen · 1916
- Material control board Gantt-school production control practice · 1918-1939
- Harvard ABC business barometer Warren Milton Persons, Harvard Economic Service · 1919
- Skeleton plot (dendrochronology) A.E. Douglass · 1919
- Gann fan and square of nine William Delbert Gann · 1920s-1930s
- Vectorcardiogram Hubert Mann (1920 concept); Ernest Frank (1956 lead system) · 1920-1956
- Audiogram Western Electric (1-A audiometer); Harvey Fletcher · 1922
- Clock chart Karsten (naming); American business practice · 1923
- Cyclograph (circular chart recorder) Instrument practice; described by Karsten · 1923
- Motion-picture chart American statistical practice; described by Karsten · 1923
- Staircased band chart Karsten (naming); American statistical practice · 1923
- Volumetric chart (solid model) Statistical model-making practice; described by Karsten · 1923
- Zone curve Karsten (naming); American statistical practice · 1923
- Shewhart control chart Walter Andrew Shewhart · 1924-1931
- Z chart (zee chart) No single inventor documented; described by Karsten · 1925
- Karsten tridimensional chart Karl G. Karsten · 1926
- Ecological pyramid Charles Elton · 1927
- Electrical well log Conrad Schlumberger, Marcel Schlumberger and Henri-Georges Doll · 1927
- Janet left-step periodic table Charles Janet · 1928
- Labanotation Rudolf Laban · 1928
- Double-mass curve US hydrologic practice; standardised by James Searcy and Clayton Hardison · 1930s-1960
- Histomap John B. Sparks · 1931
- Kubelka-Munk plot Paul Kubelka and Franz Munk · 1931
- Multiple-axis graph Described by Brinton after Brown, Bingham and Trueblood · 1931-1939
- Muller plot Hermann Joseph Muller · 1932
- Nyquist plot Harry Nyquist (Felix Strecker independently, 1930) · 1932
- Schenkerian graph Heinrich Schenker · 1932-1935
- Unit hydrograph L.K. Sherman · 1932
- Aerogram (Refsdal diagram) Aksel Refsdal · 1935
- Bode plot Hendrik Wade Bode · 1938-1945
- Elliott wave diagram Ralph Nelson Elliott · 1938
- Eye diagram Telecommunications practice, Bell Laboratories; no single originator · 1940s
- Stedman three-dimensional periodic table Donald Stedman, National Research Council of Canada · 1940s
- Line of balance Goodyear; US Navy · 1941/1962
- MMPI profile sheet Starke Rosecrans Hathaway and John Charnley McKinley · 1943
- Actinide-series table Glenn Theodore Seaborg · 1945
- Spindle diagram Alfred S. Romer · 1945
- Skew-T log-P diagram N. Herlofson · 1947
- Andrews pitchfork Alan Hall Andrews, after George Fillmore Swain via Roger Babson · mid-20th century
- Double-plotted actogram Chronobiology labs (e.g. Pittendrigh) · 1950s-1960s
- Graphic score Morton Feldman; John Cage and others · 1950+
- Kratky plot Otto Kratky with Günther Porod · 1950s
- Melograph Charles Seeger · 1950s
- Frost diagram Arthur Atwater Frost · 1951
- December 1952 Earle Brown · 1952
- Xenakis Metastaseis graph Iannis Xenakis · 1953-1954
- Bilateral deviation bar chart No single inventor documented; classified by Calvin F. Schmid · 1954
- CUSUM chart with V-mask E.S. Page; G.A. Barnard · 1954/1959
- Partograph E. Friedman; Philpott & Castle · 1954/1972
- Pre-control chart Frank Edward Satterthwaite, Rath and Strong · 1954
- Strata (silhouette) chart No single inventor documented; classified by Calvin F. Schmid · 1954
- Benesh Movement Notation Rudolf Benesh and Joan Benesh · 1955
- Thornthwaite water-balance diagram C. W. Thornthwaite and J. R. Mather · 1955
- Hypnogram William Charles Dement and Nathaniel Kleitman · 1957
- Semantic differential profile Charles Osgood · 1957
- Eshkol-Wachman Movement Notation Noa Eshkol and Avraham Wachman · 1958
- EWMA control chart S. W. Roberts · 1959
- Walter-Lieth climate diagram Walter & Lieth · 1960
- Thiel space notation Philip Thiel · 1961
- Chondrite-normalised REE plot Akimasa Masuda; Charles DuBois Coryell, Jack W. Chase and John W. Winchester · 1962-1963
- Cardew Treatise Cornelius Cardew · 1963-1967
- Benfey spiral periodic table Otto Theodor Benfey · 1964
- View from the Road notation Donald Appleyard, Kevin Lynch and John Randolph Myer · 1964
- Motation Lawrence Halprin · 1965
- Helical wheel Schiffer & Edmundson · 1967
- Ichimoku Kinko Hyo Goichi Hosoda (pen name Ichimoku Sanjin) · 1969
- Dot-matrix sequence comparison Gibbs & McIntyre · 1970
- Multi-element spider diagram Generalised from the REE plot; no single originator · 1970s-1980s
- Wehinger listening score Rainer Wehinger · 1970
- Equivolume chart Richard W. Arms Jr. · 1971
- Kiviat graph Philip J. Kiviat; named by Kenneth W. Kolence · 1973
- Rumack-Matthew nomogram Rumack & Matthew · 1975
Şu salonda da yer alabilirdi: Zaman içinde değişim 71
- Khipu (quipu) Inca administrators · c.1400-1532
- Runic calendar staff (primstav) Norwegian folk-craft tradition; maker unknown · 1457
- Scheiner sunspot small multiples Christoph Scheiner · 1626
- Cartesian coordinate system Rene Descartes and Pierre de Fermat · 1637
- Circle of fifths Mykola Dyletsky (1677); Johann David Heinichen (1728) · 1677-1728
- Newton colour circle Isaac Newton · 1704
- Hauksbee capillary curve Francis Hauksbee · 1712
- Floral clock (horologium florae) Carl Linnaeus · 1751
- New Chart of History Joseph Priestley · 1769
- Bonjean curves Bonjean, French naval engineer · 1800s
- Graphical differentiation (tangent construction) Various; codified by Carl Runge · 1800s-1920s
- Jacquard punched cards Joseph Marie Jacquard · 1804
- Stream of Time (Strom der Zeiten) Friedrich Strass · 1804
- Gompertz curve Benjamin Gompertz · 1825
- Quin historical atlas Edward Quin · 1830
- Clapeyron pressure-volume diagram Benoît Paul Émile Clapeyron · 1834
- Hitchcock paleontological chart Edward Hitchcock · 1840
- Hodograph William Rowan Hamilton · 1846-1847
- Log-log (double logarithmic) paper Léon Lalanne (anamorphosis); commercial rulings from c.1900 · 1846-1900
- Leech barometer George Merryweather · 1850
- Planimeter Jacob Amsler · 1854
- Adams Synchronological Chart Sebastian Cabot Adams · 1871
- Tide-predicting machine William Thomson (later Lord Kelvin) · 1872
- Semi-graphic table Toussaint Loua · 1873
- Harmonic analyser William Thomson (Lord Kelvin) · 1876
- Radar (star) diagram Georg von Mayr · 1877
- Integraph Bruno Abdank-Abakanowicz · 1878
- Massau graphical integration Junius Massau · 1878-1884
- Stage-discharge rating curve USGS stream-gauging practice; no single originator · 1890s
- Football play diagram Amos Alonzo Stagg and Henry Lawrence Williams · 1893
- Cricket linear scoring John Atkinson Pendlington; developed by Bill Ferguson and Bill Frindall · 1900s
- Payload-range diagram Commercial aviation performance practice; no single originator · 1900s
- Pump and system head curve Hydraulic engineering practice; no single originator · 1900s
- Reciprocal (1/x) graph paper Various · 1900s
- Waterfall (bridge) chart No originator documented; popularised by McKinsey and Company · 20th century
- Butterfly diagram E. Walter Maunder · 1904
- Harker variation diagram Alfred Harker · 1909
- Cyclegraph / chronocyclegraph Frank & Lillian Gilbreth · 1913-1917
- Moseley plot Henry Gwyn Jeffreys Moseley · 1913
- Signal progression time-space diagram US urban traffic signal practice; no single originator · 1920s
- SIMO chart Frank Bunker Gilbreth and Lillian Moller Gilbreth · 1921
- Species-area curve Olof Arrhenius · 1921
- Isotype pictorial statistics Otto & Marie Neurath, Gerd Arntz · 1925+
- Job plot (continuous variation) Paul Job · 1928
- Cobweb model of price adjustment Henry Schultz, Umberto Ricci and Jan Tinbergen independently; named by Nicholas Kaldor · 1930-1938
- Wadati diagram Kiyoo Wadati · 1933
- Power-demand relief model Detroit Edison Company · 1935
- Learning (experience) curve Theodore Paul Wright · 1936
- Shields diagram Albert Frank Shields · 1936
- Cole-Cole plot Kenneth Stewart Cole and Robert Hugh Cole · 1941
- Ellingham diagram H.J.T. Ellingham · 1944
- Nichols chart N.B. Nichols · 1947
- Survivorship curve Edward Smith Deevey Jr. · 1947
- Hovmöller diagram Ernest Hovmöller · 1949
- Electrochemical impedance (Nyquist) plot Electrochemical impedance spectroscopy practice, after Nyquist · 1950s-1970s
- Walsh diagram Arthur Donald Walsh · 1953
- Range (floating bar) chart No single inventor documented; classified by Calvin F. Schmid · 1954
- Tanabe-Sugano diagram Tanabe & Sugano · 1954
- Orgel diagram Leslie Eleazer Orgel · 1955
- Schoeller semi-log diagram Henri Schoeller · 1955
- Karyotype ideogram Cytogenetics practice after Joe Hin Tjio and Albert Levan · 1956-1960s
- Done nomogram Alan Kimball Done · 1960
- Raster plot and peristimulus time histogram Neurophysiology practice; no single originator · 1960s
- Serial vision Gordon Cullen · 1961
- Nanosecond wire Grace Brewster Murray Hopper · 1968
- Coekin polygon display J. A. Coekin · 1969
- Byron's Bender protein wire model Byron Rubin · 1970
- Forest plot Gradual; no single documented originator · 1970s-1980s
- Dot-box tally John W. Tukey · 1977
- Market Profile J. Peter Steidlmayer · 1984-1985
- Value stream map Mike Rother and John Shook · 1998