Studied from its original page
Farr circular mortality diagram
Farr circular mortality diagram · circular diagrams 'of a new form'
- Made by
- William Farr
- Year
- 1852
- Field
- Medicine
- Kind
- Data display
- Room
- Change over time
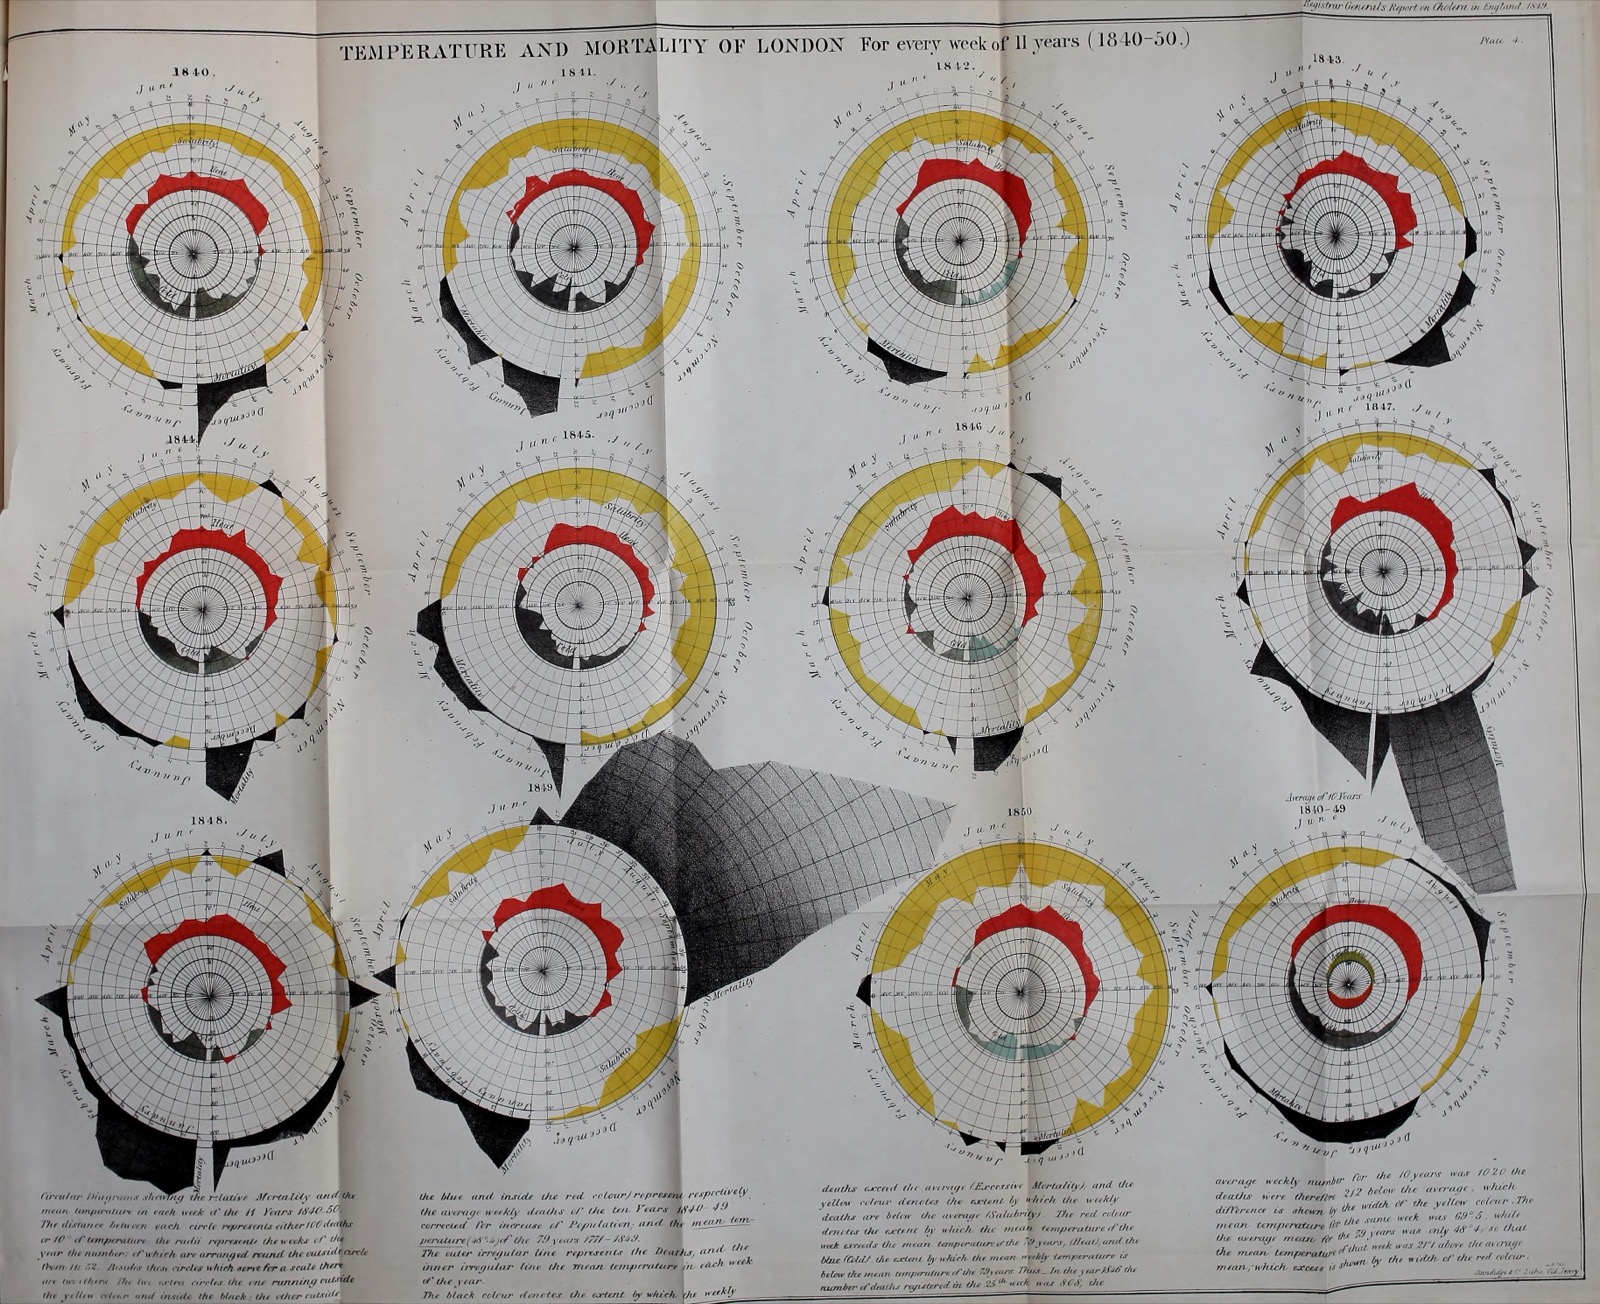
See the original page — Plate 4, 'Temperature and Mortality of London for every week of 11 years (1840-50.)' (leaf n196 of b21516911); Plate V at leaf n198 (https://archive.org/download/b21516911/page/n198_w2000.jpg)
Published 1852 (A) and Farr died in 1883, so life+70 ended in 1953 (B).
The data it needs
cycleidentity (one circle each) · categorical · yearphaseangle · ordinal · weekvalueradius · quantitative · deaths or degrees Freferenceradius of the reference circle · quantitative · same as value
Built in 9 steps, as its maker described
construction and reading of the circular diagrams, printed p. xlviii (archive leaf n63); Plate IV (eleven yearly circles, 1840-50) and Plate V (eight circles, plague years) not located in the scan
121 other forms share this skeleton
Source
Farr 1852, Report on the Mortality of Cholera in England 1848-49
Attribution checked against the source