Studied from its original page
Knapp's translated generating-curve construction
Knapp's Figur 1 · the totals of the living shown by position (Figs. 5-10)
- Made by
- Georg Friedrich Knapp
- Year
- 1868
- Field
- Social science and psychology
- Kind
- Computing chart
- Room
- How a group spreads
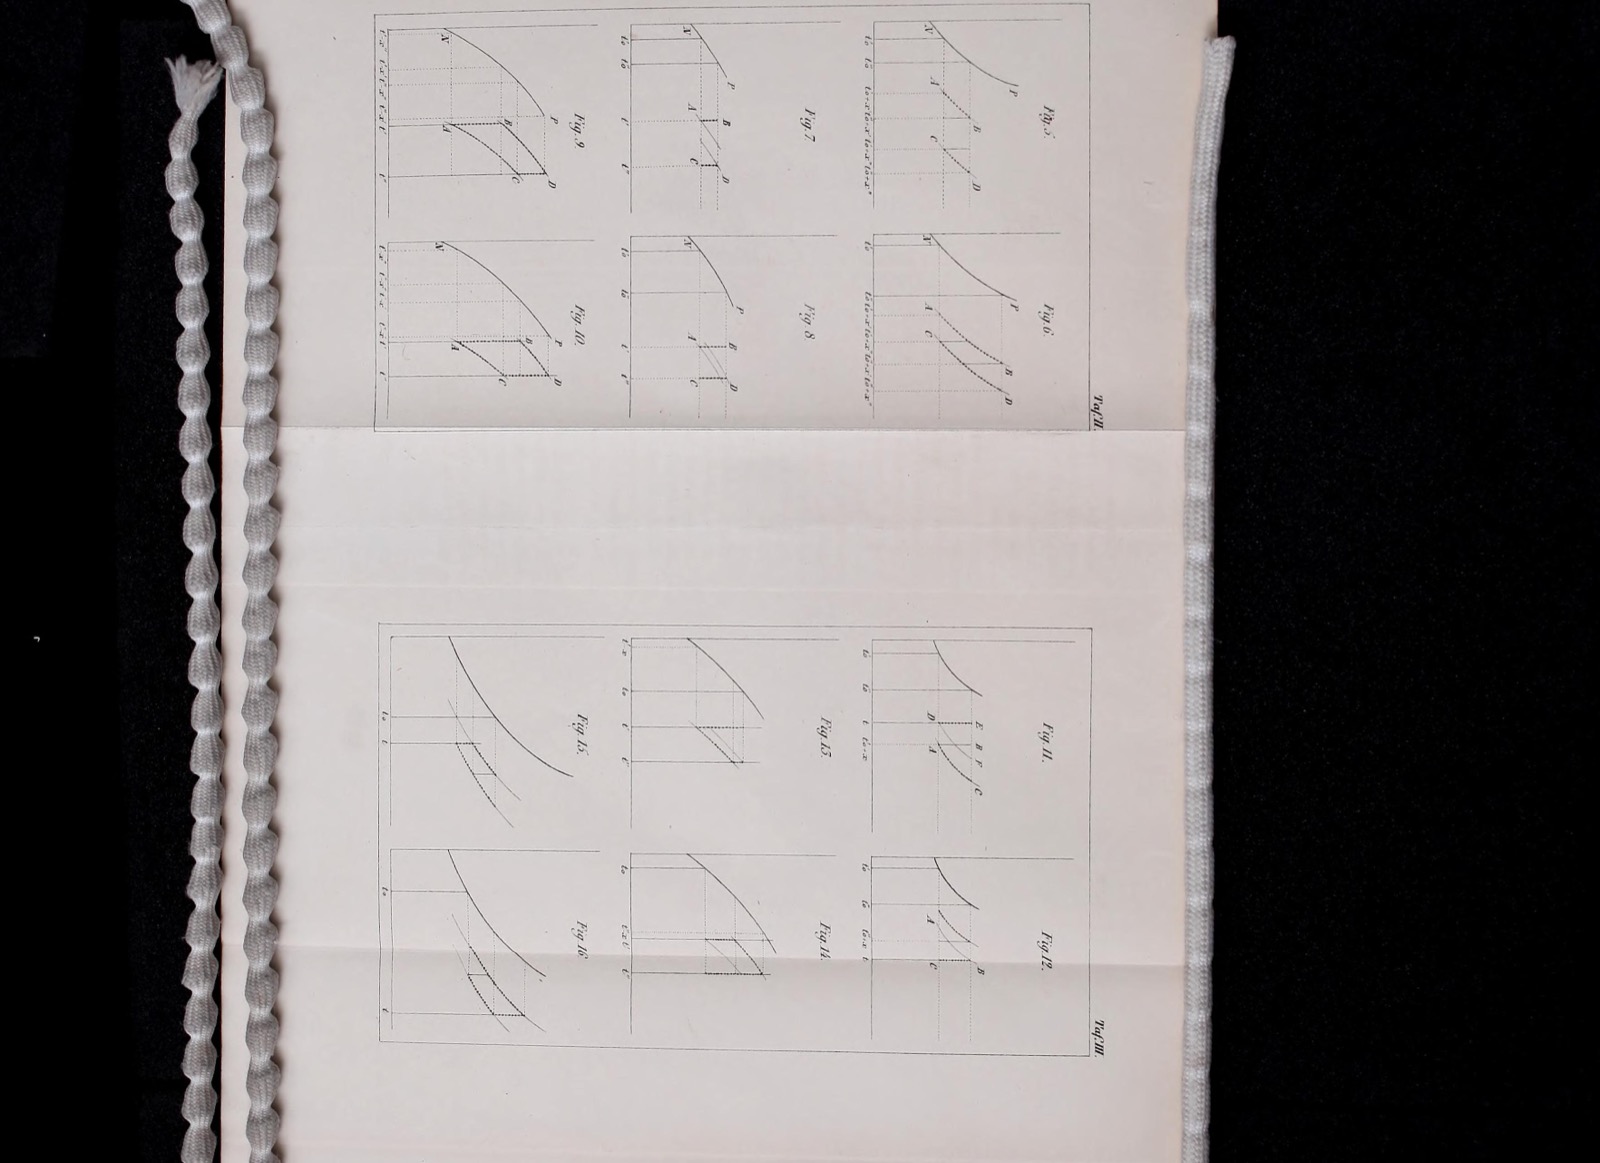
See the original page — Taf. II (Figs. 5-10) and Taf. III (Figs. 11-16), bound as one fold-out after printed p. 120 (archive leaf n128)
Published 1868 (A) and Knapp died in 1926, so life+70 ended in 1996 (B).
The data it needs
timeposition · temporal · yearcumulative_birthsvalue (generating curve) · count · personsageposition along a decay curve · quantitative · yearssurvivalvalue (decay curve) · proportion · 0-1
Built in 7 steps, as its maker described
Figur 1 described pp. 13, 16, 25-26; Figs. 5-10 pp. 39-40; plates Taf. II-III at archive leaf n128
17 other forms share this skeleton
Source
Knapp 1868, Über die Ermittlung der Sterblichkeit aus den Aufzeichnungen der Bevölkerungs-Statistik
Attribution checked against the source