Studied from its original page
Standard-gauge historical-curve atlas
the sheaf (Marshall's image) · historical curves on a standard gauge
- Made by
- Alfred Marshall
- Year
- 1885
- Field
- Economics and markets
- Kind
- Data display
- Room
- Change over time
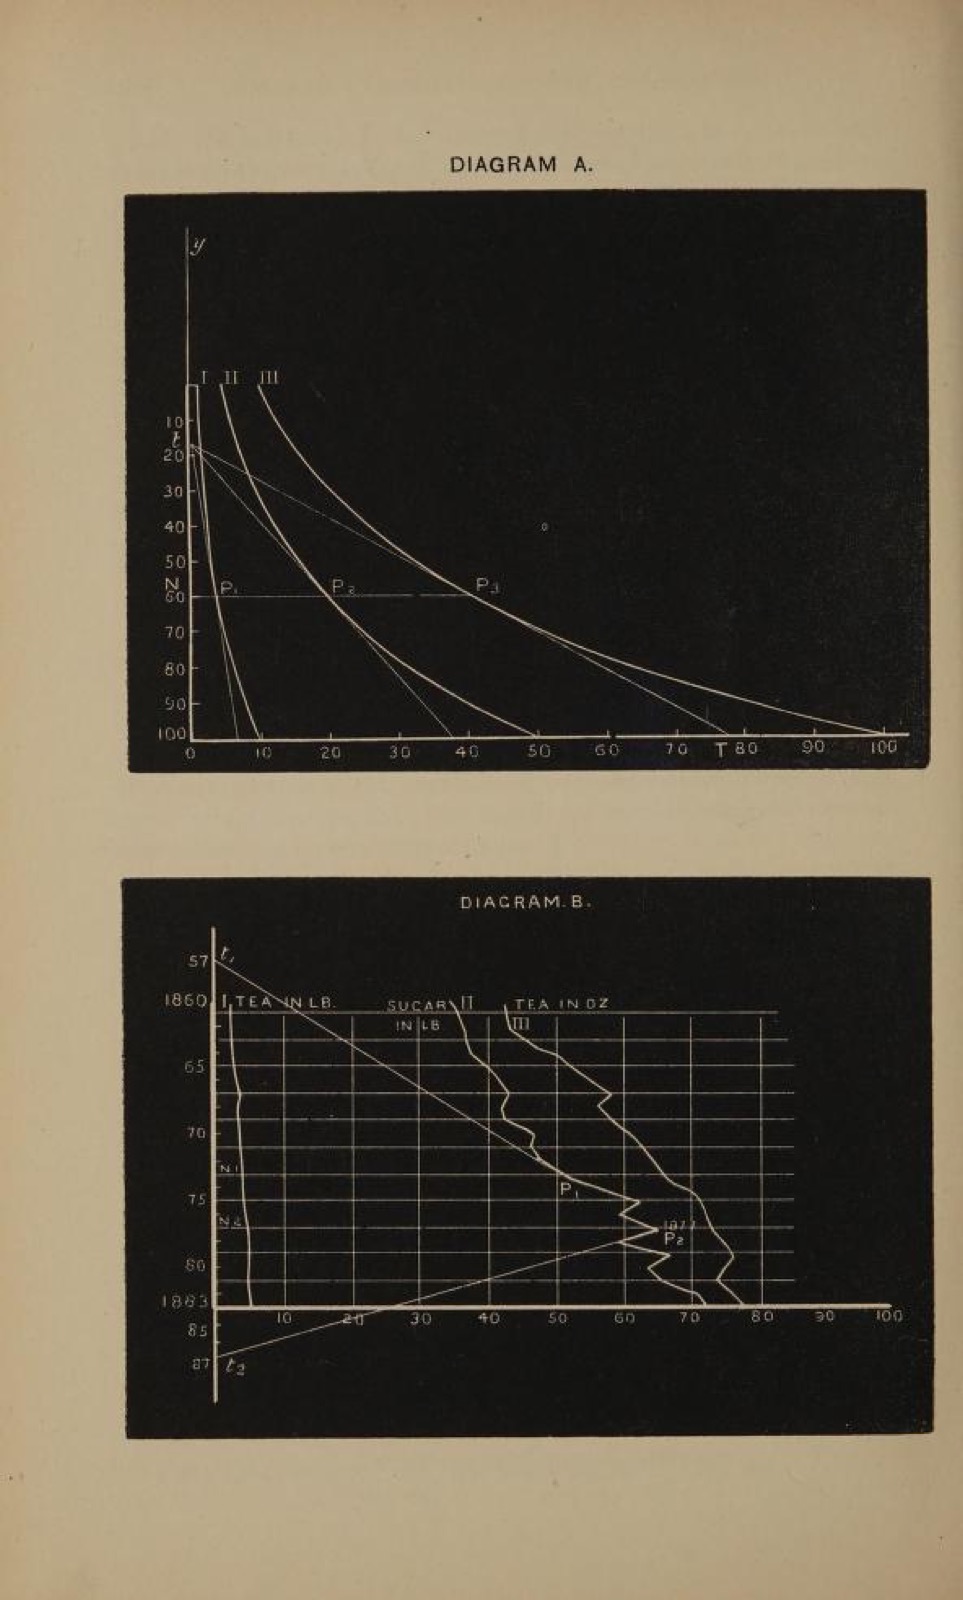
See the original page — Diagrams A and B, plate between pp. 256 and 257 (archive leaf n301)
Published 1885 (A) and Marshall died in 1924, so life+70 ended in 1994 (B).
The data it needs
seriesidentity · categoricaldateaxis · temporal · yearvaluevalue · quantitative · the series' own unitsubjectgrouping (page) · categoricalplacegrouping (optional; country) · categorical
Built in 6 steps, as its maker described
pp. 251-260; Diagrams A and B on the plate between pp. 256 and 257 (archive leaf n301)
121 other forms share this skeleton
Source
Attribution checked against the source