Redrawn by us
Schemes of distribution drawn in opposed directions
- Made by
- Francis Galton
- Year
- 1889
- Field
- Statistics
- Kind
- Data display
- Room
- How a group spreads — Placed by reading its description, not yet studied
What it shows
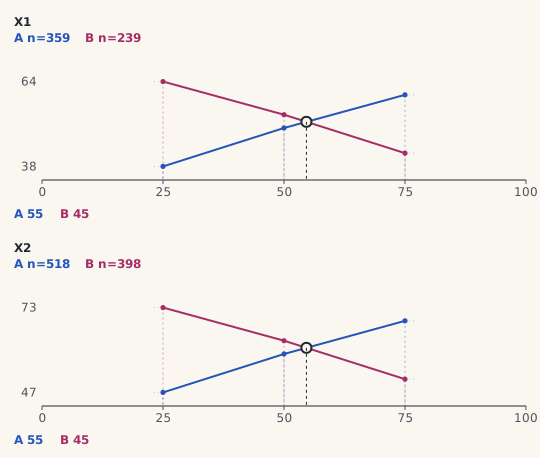
Two populations drawn facing each other on one percentile base, so that their curves cross once.
How it is read
Where the curves cross, the same value sits at that percentile in one population and at the opposite percentile in the other.
What we kept from the original
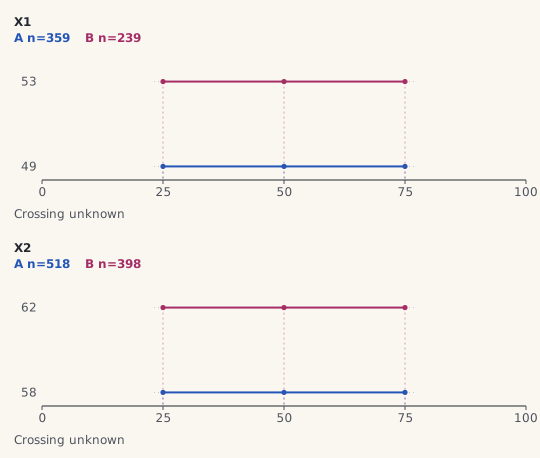
Two schemes of distribution drawn facing each other on one base of a hundred grades, read where their curves cross.
What we changed
Galton drew whole curves from measured individuals; ours has only the three published quartiles, so each curve is two straight pieces across the middle half, and a crossing outside it is reported as unknown.
17 other forms share this skeleton
Source
Galton 1889, Natural Inheritance, Figs. 4-6, p. 40
Attribution checked against the source