Studied from its original page
Hexagonal chart (abaque hexagonal)
hexagonal chart · transparent-index addition chart · abaque hexagonal (the catalog's name for the device, S003)
- Made by
- Charles Lallemand
- Year
- 1885
- Field
- Nomograms and computing charts
- Kind
- Computing chart
- Room
- Charts that compute
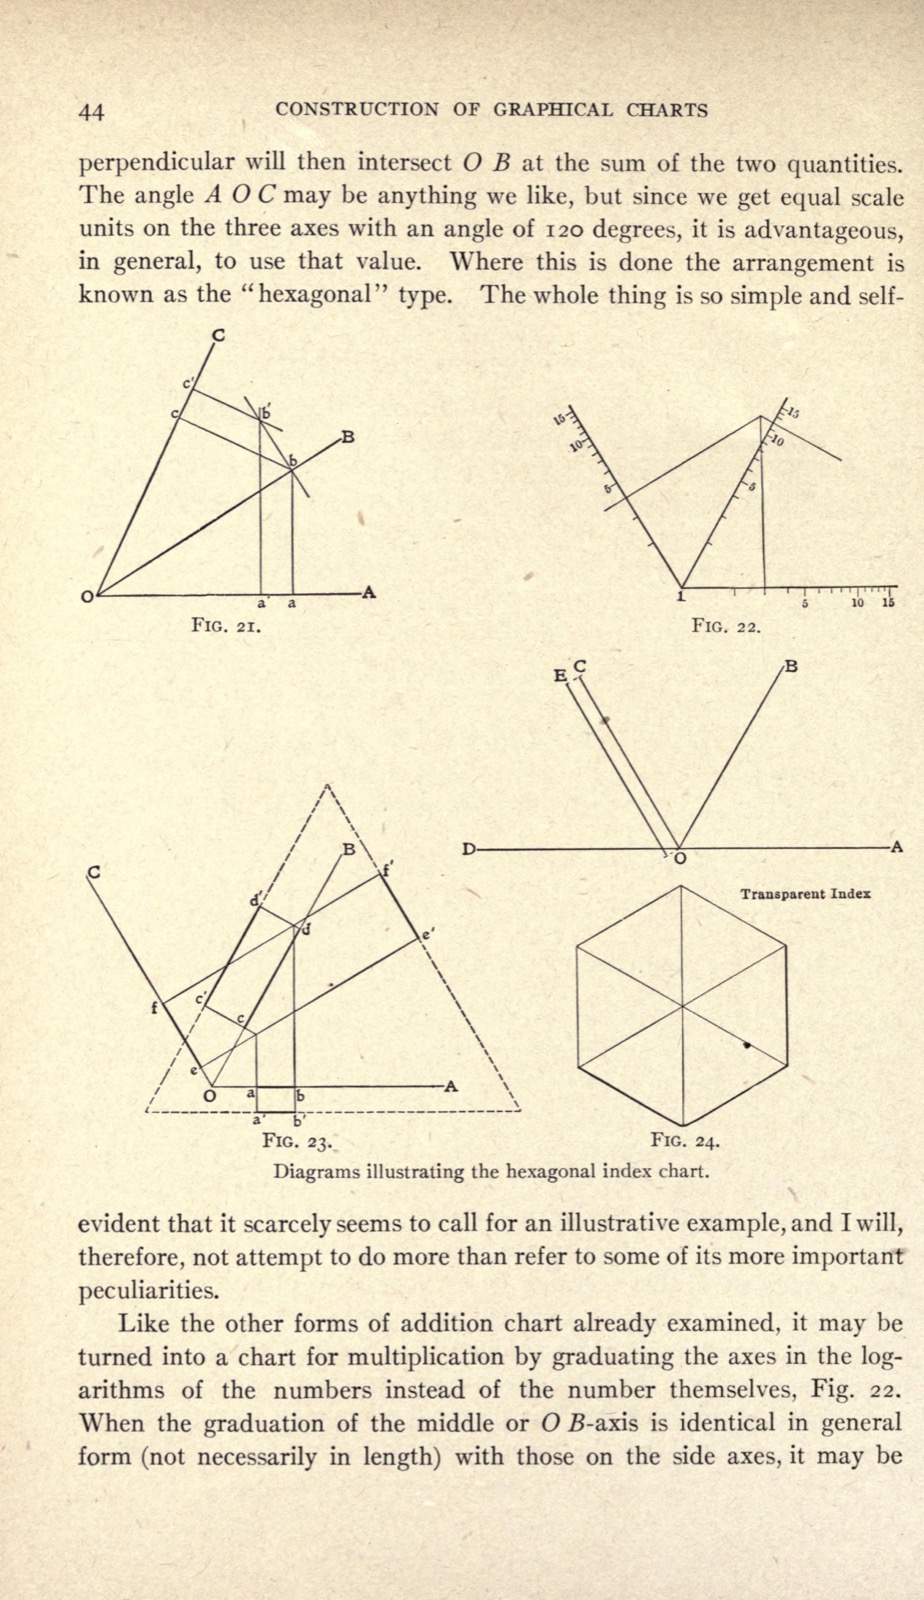
See the original page — Figs. 21-24, printed p. 44 (archive leaf n55)
Published 1910 (A) and Peddle (1933) and Lallemand (1938) both died long before 1955 (B ended 2008 at the latest).
The data it needs
ainput on axis OA · quantitativecinput on axis OC · quantitativeboutput on axis OB: a + c, or a x c on log scales · quantitativedfurther input on axis OD, chained with b (Fig. 24) · quantitative
Built in 6 steps, as its maker described
ch. IV 'The Hexagonal Index Chart', pp. 43-47, Figs. 21-24 (p. 44)
1 other forms share this skeleton
Source
Lallemand 1885; Doerfler essays
Attribution checked against the source