Room
Charts that compute
A relation among quantities drawn so that the answer can be read off with a ruler, a thread or the eye. The chart does the arithmetic.
Redrawn by us 1
Stanhope square demonstrator
Charles Stanhope · c.1805
Studied from its original page 12
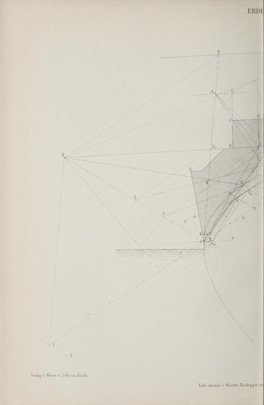
Culmann earth-pressure construction
Karl Culmann · 1866
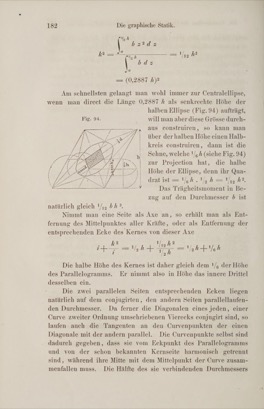
Der Kern des Querschnitts, with the Centralellipse
Karl Culmann · 1866
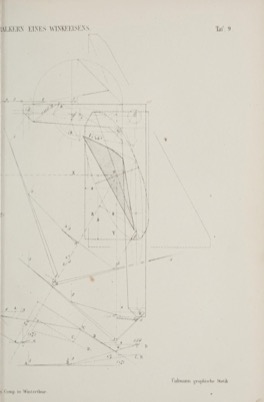
Doppeltes Seilpolygon (two funicular polygons with two pole distances)
Karl Culmann · 1866
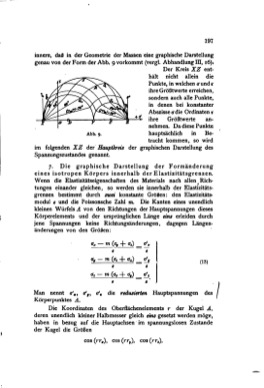
Three-circle Mohr diagram
Christian Otto Mohr · 1882
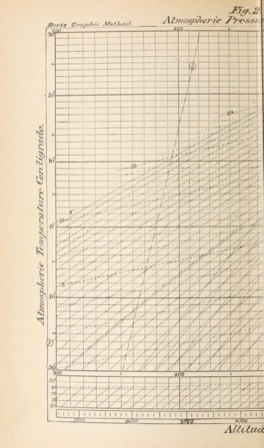
Hertz thermodynamic diagram for aerology
Heinrich Hertz · 1884
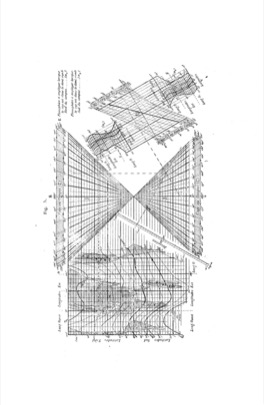
Abaque hexagonal à échelles multiples
Charles Lallemand (reported and systematised by Maurice d'Ocagne) · 1885
A ship's compass error worked out on paper: a hexagonal chart whose scales are themselves small charts, nested level by level.
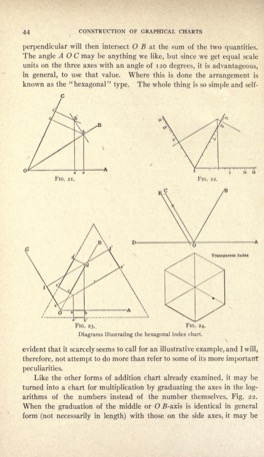
Hexagonal chart (abaque hexagonal)
Charles Lallemand · 1885
Nomogramme à index en équerre
Junius Massau (square index for the complete cubic, simplified by Maurice d'Ocagne); related square-index charts by R. Soreau and the Siegler profilomètre · c.1885
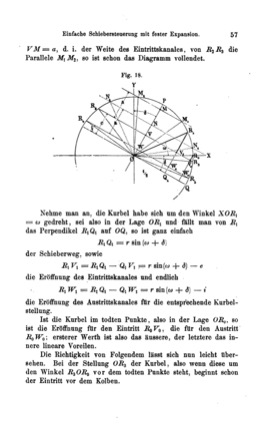
Zeuner / Reuleaux valve diagram (Das Diagramm von Reuleaux)
Franz Reuleaux (this diagram), presented by Gustav Zeuner beside his own polar diagram · 1888
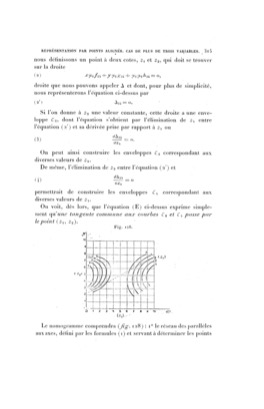
Droites à doubles enveloppes
Père Poulain (principle, letter to d'Ocagne of 16 October 1891); B. Paladini (contact-trajectory example on an equation of Pesci, Rivista marittima, March 1898); systematised by Maurice d'Ocagne · 1891-98
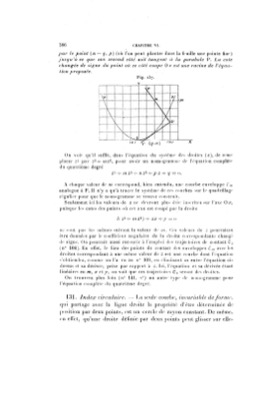
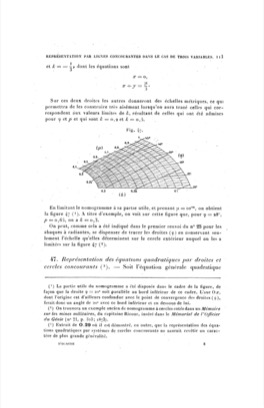
Nomogrammes à cercles concourants
Maurice d'Ocagne (general theory, paper of 1896); an earlier labelled-circle chart by Captain Ricour (1873) · 1896
Compound nomogram with pivot line
Maurice d'Ocagne; Joseph Lipka · 1899-1930
Catalogued 172
- Antikythera mechanism Unknown Greek workshop · 150-100 BCE
- Astrolabe Nastulus (earliest dated instrument); Hellenistic theoretical origin · 927-928 (earliest dated survivor)
- Exchequer tally stick and chequerboard Exchequer of Henry I, England · 1100-1179
- Llullian combinatorial wheels Ramon Llull · 1308
- Apian volvelle Petrus Apianus · 1540
- Galileo's sector (compasso geometrico) Galileo Galilei · 1597
- Weaving draft and drawdown Weaving practice; no single originator · 1600s-1800s
- Napier's bones John Napier · 1617
- Gunter's line of numbers Edmund Gunter · 1620
- Slide rule William Oughtred · 1622
- Circular slide rule Richard Delamain · 1630
- Cartesian coordinate system Rene Descartes and Pierre de Fermat · 1637
- Hauksbee capillary curve Francis Hauksbee · 1712
- Orrery John Rowley, on George Graham's mechanism · 1712-1713
- Adams solid geometry models George Adams · 1750
- Graphic multiplication tables of Pouchet Louis-Ezéchiel Pouchet · 1795
- Descriptive geometry (Monge projections) Gaspard Monge · 1799
- Bonjean curves Bonjean, French naval engineer · 1800s
- Conversion scale (double scale) Anonymous instrument makers · 1800s
- Graphical differentiation (tangent construction) Various; codified by Carl Runge · 1800s-1920s
- Argand diagram Jean-Robert Argand (Caspar Wessel independently, 1799) · 1806
- Carlyle circle Thomas Carlyle (attrib.); John Leslie · 1817
- Gompertz curve Benjamin Gompertz · 1825
- Clapeyron pressure-volume diagram Benoît Paul Émile Clapeyron · 1834
- Sumner line Thomas Hubbard Sumner · 1837
- Olivier string models Theodore Olivier · 1839-1853
- Grid (network) nomogram Léon Lalanne · 1843-1846
- Isopleth (contour computing) chart Léon Lalanne; later widespread · 1843-1900
- Lalanne abacus / geometric anamorphosis Léon Lalanne · 1843-1846
- Hodograph William Rowan Hamilton · 1846-1847
- Log-log (double logarithmic) paper Léon Lalanne (anamorphosis); commercial rulings from c.1900 · 1846-1900
- Planimeter Jacob Amsler · 1854
- Graphical statics (force and funicular polygons) Karl Culmann · 1866
- Lill's method Eduard Lill · 1867
- Tide-predicting machine William Thomson (later Lord Kelvin) · 1872
- Harmonic analyser William Thomson (Lord Kelvin) · 1876
- Cylindrical (helical) slide rule George Fuller · 1878
- Dühring plot Karl Eugen Dühring · 1878
- Integraph Bruno Abdank-Abakanowicz · 1878
- Massau graphical integration Junius Massau · 1878-1884
- Begriffsschrift notation Gottlob Frege · 1879
- Mathematical plaster model Felix Klein's Goettingen school; models by Adolf Weiler and others · 1880
- Edgeworth box Francis Ysidro Edgeworth; boxed form from Pareto and Bowley · 1881
- Thacher's calculating instrument Edwin Thacher · 1881
- Mohr's circle Otto Mohr · 1882
- Alignment nomogram (alignment chart) Maurice d'Ocagne · 1884-1899
- Concurrent-scale nomogram Maurice d'Ocagne · 1884-1899
- Curved-scale nomogram Maurice d'Ocagne · 1884-1899
- N chart (Z chart nomogram) Maurice d'Ocagne · 1884
- Parallel-scale nomogram (three parallel scales) Maurice d'Ocagne · 1884
- Van 't Hoff plot Jacobus Henricus van 't Hoff · 1884
- Transparency-overlay nomogram Charles Lallemand; Maurice d'Ocagne · 1885-1920
- Velocity and acceleration polygon Ludwig Burmester · 1888
- Arrhenius plot Svante Arrhenius · 1889
- Hanging chain model Antoni Gaudi · 1889
- Stage-discharge rating curve USGS stream-gauging practice; no single originator · 1890s
- Genaille-Lucas rulers Henri Genaille and Édouard Lucas · 1891
- Phasor diagram Charles Proteus Steinmetz · 1893
- Heyland circle diagram Alexander Heinrich Heyland · 1894
- Roozeboom ternary phase diagram Hendrik Willem Bakhuis Roozeboom · 1894
- Existential graphs Charles Sanders Peirce · 1896
- Iron-carbon phase diagram William Chandler Roberts-Austen (1897); Hendrik Willem Bakhuis Roozeboom (1900) · 1897-1900
- Goodman-Haigh constant-life diagram John Goodman (1899); Bernard Parker Haigh (1917) · 1899-1917
- Circular nomogram Maurice d'Ocagne (type); various · 1900-1930
- Crum Brown mathematical surface Alexander Crum Brown · 1900
- Payload-range diagram Commercial aviation performance practice; no single originator · 1900s
- Pump and system head curve Hydraulic engineering practice; no single originator · 1900s
- Reciprocal (1/x) graph paper Various · 1900s
- Seyler coal classification chart Clarence Arthur Seyler · 1900
- Sun-path diagram Various; popularised by Victor Olgyay · 1900s
- Soreau classification of nomogram genera Rodolphe Soreau · 1901
- Crossover (break-even) chart Henry Hess · 1903
- Mollier enthalpy-entropy (h-s) chart Richard Mollier · 1904
- Pressure-enthalpy (log p-h) chart Richard Mollier (family); refrigeration practice · 1904-1930s
- Psychrometric chart Willis Carrier (h-x version: Mollier 1923) · 1904/1911
- Tafel plot Julius Tafel · 1905
- Jänecke projection Erich Jänecke · 1906
- Minkowski space-time diagram Hermann Minkowski · 1908
- Pearson beta1-beta2 chart Charles Rhind (chart form); Karl Pearson (adopted) · 1909-1916
- Hill plot Archibald Vivian Hill · 1910
- Moseley plot Henry Gwyn Jeffreys Moseley · 1913
- Bjerrum / Sillén log C-pH diagram Niels Bjerrum; L.G. Sillén · 1914/1959
- Stanton diagram Thomas Edward Stanton and John Ransome Pannell · 1914
- Du Bois body surface area nomogram Delafield Du Bois and Eugene Floyd Du Bois · 1916
- Stern-Volmer plot Otto Stern and Max Volmer · 1919
- Ponchon-Savarit diagram Marcel Ponchon (1921) and Raoul Savarit (1922) · 1921-1922
- Species-area curve Olof Arrhenius · 1921
- Cox chart Edwin Richard Cox · 1923
- Brønsted catalysis plot Johannes Nicolaus Brønsted and Kai Julius Pedersen · 1924
- Partial residual plot Mordecai Joseph Brill Ezekiel · 1924
- Schmidt graphical method for transient conduction Ernst Schmidt · 1924
- McCabe-Thiele diagram McCabe & Thiele · 1925
- Thorndike chart Frances Thorndike · 1926
- Fowler-Nordheim plot Ralph Howard Fowler and Lothar Wolfgang Nordheim · 1928
- Henderson blood nomogram Lawrence Joseph Henderson · 1928
- Isobologram Siegfried Loewe · 1928
- Job plot (continuous variation) Paul Job · 1928
- Operating characteristic (OC) curve Harold Dodge and Harry Romig · 1929-1944
- Ballistic computing cam Naval fire-control engineering · 1930
- Cobweb model of price adjustment Henry Schultz, Umberto Ricci and Jan Tinbergen independently; named by Nicholas Kaldor · 1930-1938
- Evans corrosion diagram Ulick Richardson Evans · 1930s
- TTT (time-temperature-transformation) diagram Edgar Collins Bain and Edmund S. Davenport · 1930
- V-n diagram (flight envelope) Airworthiness regulation practice; no single originator · 1930s-1940s
- Intensity-duration-frequency curves Charles W. Sherman · 1931
- Log-square paper F. C. Martin and Dickson H. Leavens · 1931
- Allometric plot Julian Sorell Huxley · 1932
- Hanes-Woolf plot Charles Samuel Hanes (equation); Barnet Woolf (plot form) · 1932
- Kleiber metabolic scaling curve Max Kleiber · 1932
- Wadati diagram Kiyoo Wadati · 1933
- Clopper-Pearson confidence belts Clopper & Pearson · 1934
- Hunter-Nash method Thomas Graham Hunter and Arthur William Nash · 1934
- Lineweaver-Burk double-reciprocal plot Lineweaver & Burk · 1934
- Probit plot Chester Ittner Bliss · 1934
- CCT (continuous cooling transformation) diagram Developed from Erich Scheil's additivity rule; no single originator · 1935-1940s
- Eyring plot Henry Eyring (with Evans and Polanyi independently) · 1935
- Traffic fundamental diagram Bruce Douglas Greenshields · 1935
- Learning (experience) curve Theodore Paul Wright · 1936
- Shields diagram Albert Frank Shields · 1936
- E6B wind triangle computer Philip Dalton · 1937
- Hammett plot Louis Hammett · 1937
- Pourbaix (potential-pH) diagram Marcel Pourbaix · 1938
- Predominance-area diagram Marcel Pourbaix and successors · 1938-1945
- Guinier plot André Guinier · 1939
- Maneuvering board US Navy · WWII era
- Smith chart Phillip H. Smith · 1939
- Depth-area-duration curves US Weather Bureau and Corps of Engineers practice; no single originator · 1940s
- Othmer plot Donald Frederick Othmer · 1940s
- Cole-Cole plot Kenneth Stewart Cole and Robert Hugh Cole · 1941
- Eadie-Hofstee plot George Sharp Eadie (1942); Barend Hofstee (1959) · 1942-1959
- Ellingham diagram H.J.T. Ellingham · 1944
- Moody diagram Lewis F. Moody · 1944
- Wind-chill nomogram Paul Siple and Charles Passel · 1945
- Davenport diagram Horace W. Davenport · 1947
- Heisler charts M.P. Heisler · 1947
- Holdridge life-zone diagram Leslie Holdridge · 1947
- Nichols chart N.B. Nichols · 1947
- SMB wave forecasting curves Harald Ulrik Sverdrup and Walter Heinrich Munk; revised by Charles Bretschneider (1952) · 1947
- Loedel diagram Enrique Loedel Palumbo · 1948
- Richardson-Jeffes nomographic scales Frederick Denys Richardson and John Henry Eric Jeffes · 1948
- Root locus Walter R. Evans · 1948
- Zimm plot Bruno Hasbrouck Zimm · 1948
- Benesi-Hildebrand plot Harry A. Benesi and Joel Henry Hildebrand · 1949
- MONIAC hydraulic computer Alban William Housego Phillips · 1949
- Scatchard plot George Scatchard · 1949
- Schaeffler diagram Anton L. Schaeffler · 1949
- Carpet plot Aerospace design practice · 1950s
- Electrochemical impedance (Nyquist) plot Electrochemical impedance spectroscopy practice, after Nyquist · 1950s-1970s
- Pearson-Hartley power charts Egon Pearson and Herman Otto Hartley · 1951
- Gran plot Gunnar Gran · 1952
- Veitch chart Edward Westbrook Veitch · 1952
- Bioclimatic chart Victor Olgyay · 1953/1963
- Dixon plot Malcolm Dixon · 1953
- Karnaugh map Maurice Karnaugh · 1953
- Walsh diagram Arthur Donald Walsh · 1953
- Williamson-Hall plot Gwilym Keith Williamson and William Henry Hall · 1953
- Tanabe-Sugano diagram Tanabe & Sugano · 1954
- Orgel diagram Leslie Eleazer Orgel · 1955
- Shading mask protractor Victor Olgyay and Aladár Olgyay · 1957
- Swingometer Peter Milne; refined by David Butler and Robert McKenzie · 1959
- Done nomogram Alan Kimball Done · 1960
- Brehme diagram Robert W. Brehme · 1962
- Penrose (conformal) diagram Roger Penrose · 1963-1964
- Siggaard-Andersen alignment nomogram Ole Siggaard-Andersen · 1963
- Larson binomial nomogram Harold J. Larson · 1966
- Tauc plot Jan Tauc with Radu Grigorovici and Anina Vancu · 1966
- Nanosecond wire Grace Brewster Murray Hopper · 1968
- Givoni building bioclimatic chart Baruch Givoni · 1969
- Direct linear plot Eisenthal & Cornish-Bowden · 1974
- Fagan nomogram Terrence Fagan · 1975
- Whittaker biome diagram Robert Harding Whittaker · 1975
- Resistant line John Wilder Tukey · 1977
- Altman sample-size nomogram Douglas G. Altman · 1982
Could also hang in: Charts that compute 50
- Square of opposition Aristotle (theory); diagram added by later commentators · 4th century BCE - later
- Luoshu and Hetu diagrams Anonymous; named and paired by Song scholars · 1st century CE - 12th century
- al-Biruni lunar phase diagrams Abu Rayhan al-Biruni · 1029
- Physical spline and ducks Shipbuilding and lofting practice · 1750
- Tableau economique Francois Quesnay · 1758
- GZ curve and cross curves of stability George Atwood (righting arm); later naval architecture practice · 1796-1900s
- Cam displacement diagram Machine-design practice; no single originator · 1800s-1900s
- Cobweb plot Attribution contested (Lemeray; Verhulst; Legendre) · 1800s-1900s
- Isometric projection (Farish) William Farish · 1822
- Lissajous figure Jules Antoine Lissajous (Nathaniel Bowditch, 1815) · 1857
- Maxwell-Cremona reciprocal diagram J.C. Maxwell; Luigi Cremona · 1864/1872
- Kundt's tube August Kundt · 1866
- Andrews carbon dioxide isotherms Thomas Andrews · 1869
- S-N (Wohler) curve August Wöhler · 1870
- Phase portrait and direction field Henri Poincaré · 1881
- Emagram After Hertz; named by Refsdal · 1884-1930
- Carroll diagram Charles Lutwidge Dodgson (Lewis Carroll) · 1886-1896
- Lilienthal polar diagram Otto Lilienthal · 1889
- Seismic travel-time curve Richard Dixon Oldham (empirical); Karl Zoeppritz (theoretical) · 1897-1907
- Pressure-volume loop Otto Frank · 1899
- Compressor map Turbomachinery testing practice; no single originator · 1900s
- Neuhoff pseudo-adiabatic chart Otto Neuhoff · 1900
- Stereonet (Wulff and Schmidt nets) G. Wulff; W. Schmidt · 1902/1925
- Punnett square Reginald Crundall Punnett · 1905-1906
- Rubens tube Heinrich Rubens · 1905
- Weber location triangle Alfred Weber · 1909
- Tephigram Napier Shaw · 1915
- Gann fan and square of nine William Delbert Gann · 1920s-1930s
- Axonometric chart John B. Peddle; described by Karsten · 1923
- Grotrian diagram Walter Grotrian · 1928
- Hubble diagram Edwin Hubble · 1929
- Kubelka-Munk plot Paul Kubelka and Franz Munk · 1931
- Nyquist plot Harry Nyquist (Felix Strecker independently, 1930) · 1932
- Aerogram (Refsdal diagram) Aksel Refsdal · 1935
- Darrow-Yannet diagram Daniel Cady Darrow and Herbert Yannet · 1935
- Bode plot Hendrik Wade Bode · 1938-1945
- Latimer diagram Wendell Mitchell Latimer · 1938
- Skew-T log-P diagram N. Herlofson · 1947
- Andrews pitchfork Alan Hall Andrews, after George Fillmore Swain via Roger Babson · mid-20th century
- Decision tree (decision analysis) Operations research practice; no single originator · mid-20th century
- Kratky plot Otto Kratky with Günther Porod · 1950s
- Frost diagram Arthur Atwater Frost · 1951
- Wilcox / US Salinity Lab diagram Richards (USDA Handbook 60); Wilcox · 1954-1955
- Chew-Frautschi plot Geoffrey F. Chew and Steven C. Frautschi · 1961
- Globus IMP navigation indicator Soviet spacecraft instrumentation · 1961
- Woodward-Hoffmann correlation diagram Robert Burns Woodward and Roald Hoffmann · 1965
- Rumack-Matthew nomogram Rumack & Matthew · 1975
- Seven new QC tools JUSE committee including Shigeru Mizuno · 1979
- Bland-Altman plot John Martin Bland and Douglas Graham Altman · 1986
- Ashby material selection chart Michael Farries Ashby · 1989