Studied from its original page
Lexis diagram
Lexis's own diagram (not the modern Lexis diagram)
- Made by
- Wilhelm Lexis
- Year
- 1875
- Field
- Social science and psychology
- Kind
- Concept diagram
- Room
- Lives and events
What it shows
Every life as a vertical line rising from its moment of birth: age runs up the page, and dates run as descending diagonals.
How it is read
Count the deaths in a vertical band for one generation, a horizontal band for one age, or a diagonal band for one period.
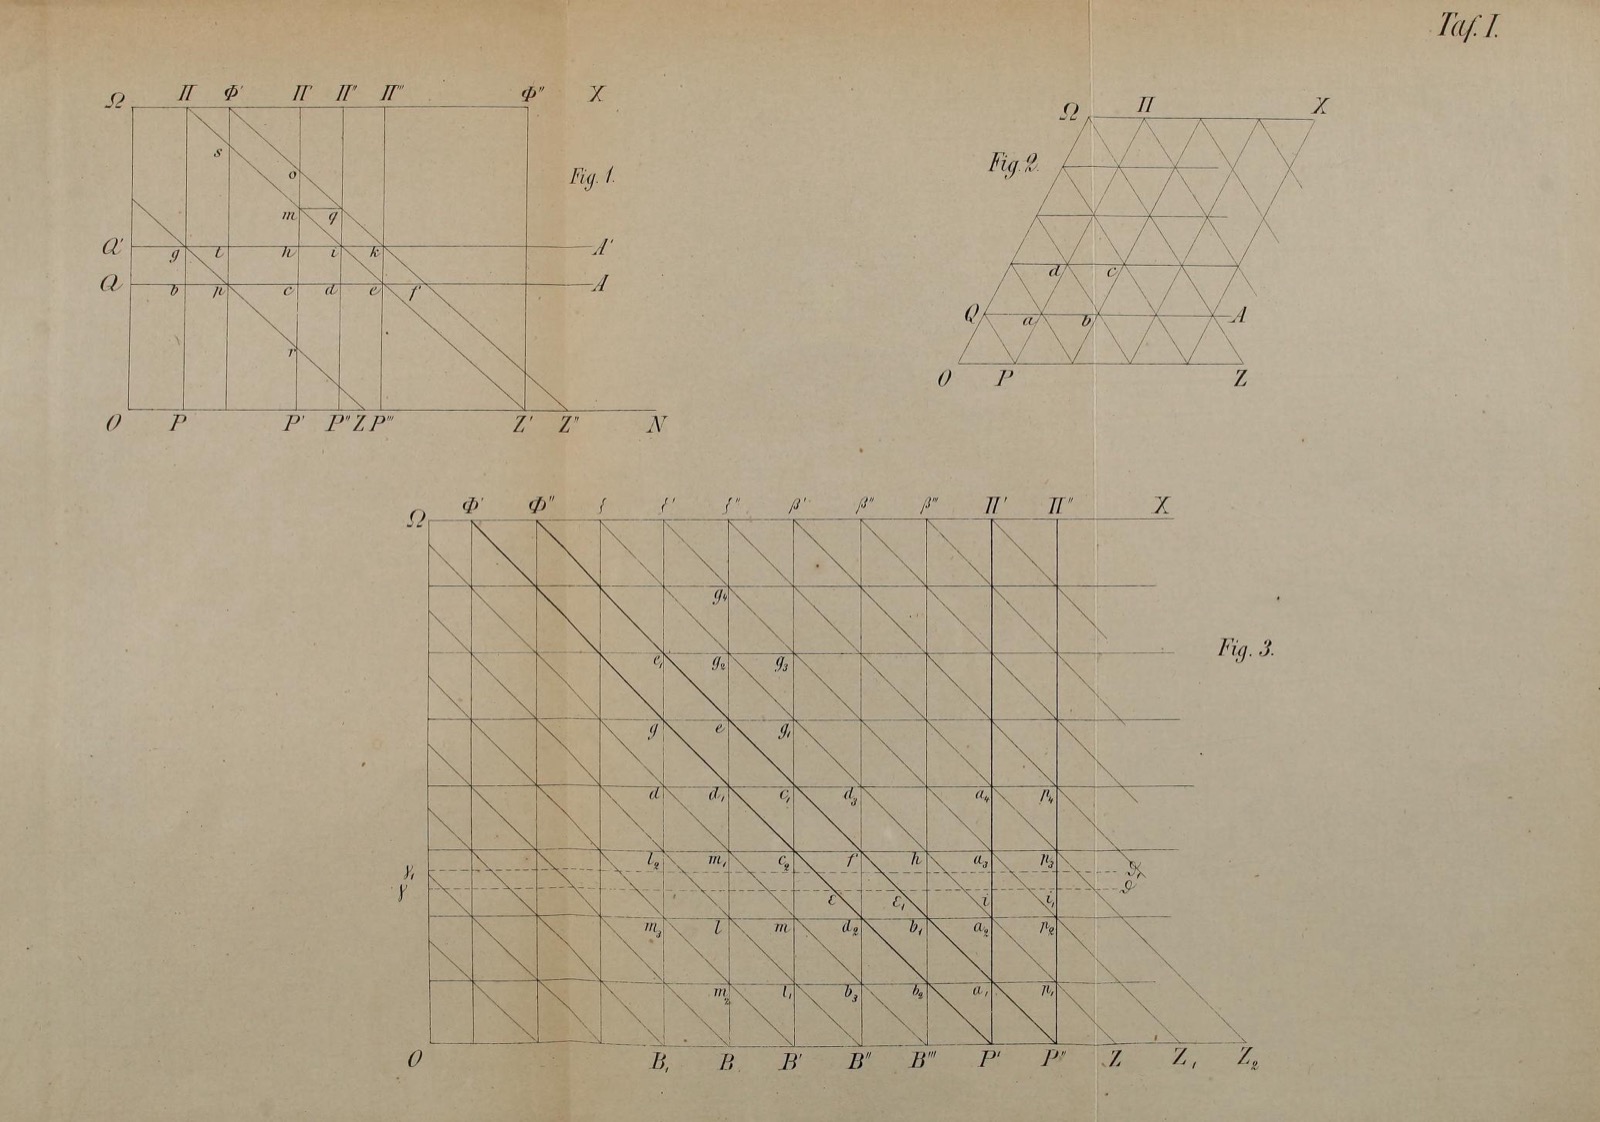
See the original page — Taf. I, Figs. 1-3, folding plate after the text (leaf n150 of einleitungindiet00lexi)
Published 1875 (A) and Lexis died in 1914, so life+70 ended in 1984 (B).
The data it needs
birth_momentposition on the birth axis · temporal · dateexit_momentgives age at death as exit minus birth · temporal · dateexit_kindstatus (death or still alive) · categorical
Built in 7 steps, as its maker described
Fig. 1 introduced p. 5 (§7) and constructed pp. 5-7 (Google copy leaves n16-n18); the 45-degree specification p. 7 and its erratum 'Berichtigungen und Einschaltungen' (leaf n11); Fig. 2 (60-degree axes) in a footnote on p. 13 (leaf n24); this copy lacks the plate
7 other forms share this skeleton
Source
Lexis 1875, Einleitung in die Theorie der Bevölkerungsstatistik
Attribution checked against the source