Studied from its original page
Hertz thermodynamic diagram for aerology
Hertz thermodynamic diagram for aerology (catalog S227) · Hertz graphic method
- Made by
- Heinrich Hertz
- Year
- 1884
- Field
- Meteorology and climate
- Kind
- Computing chart
- Room
- Charts that compute
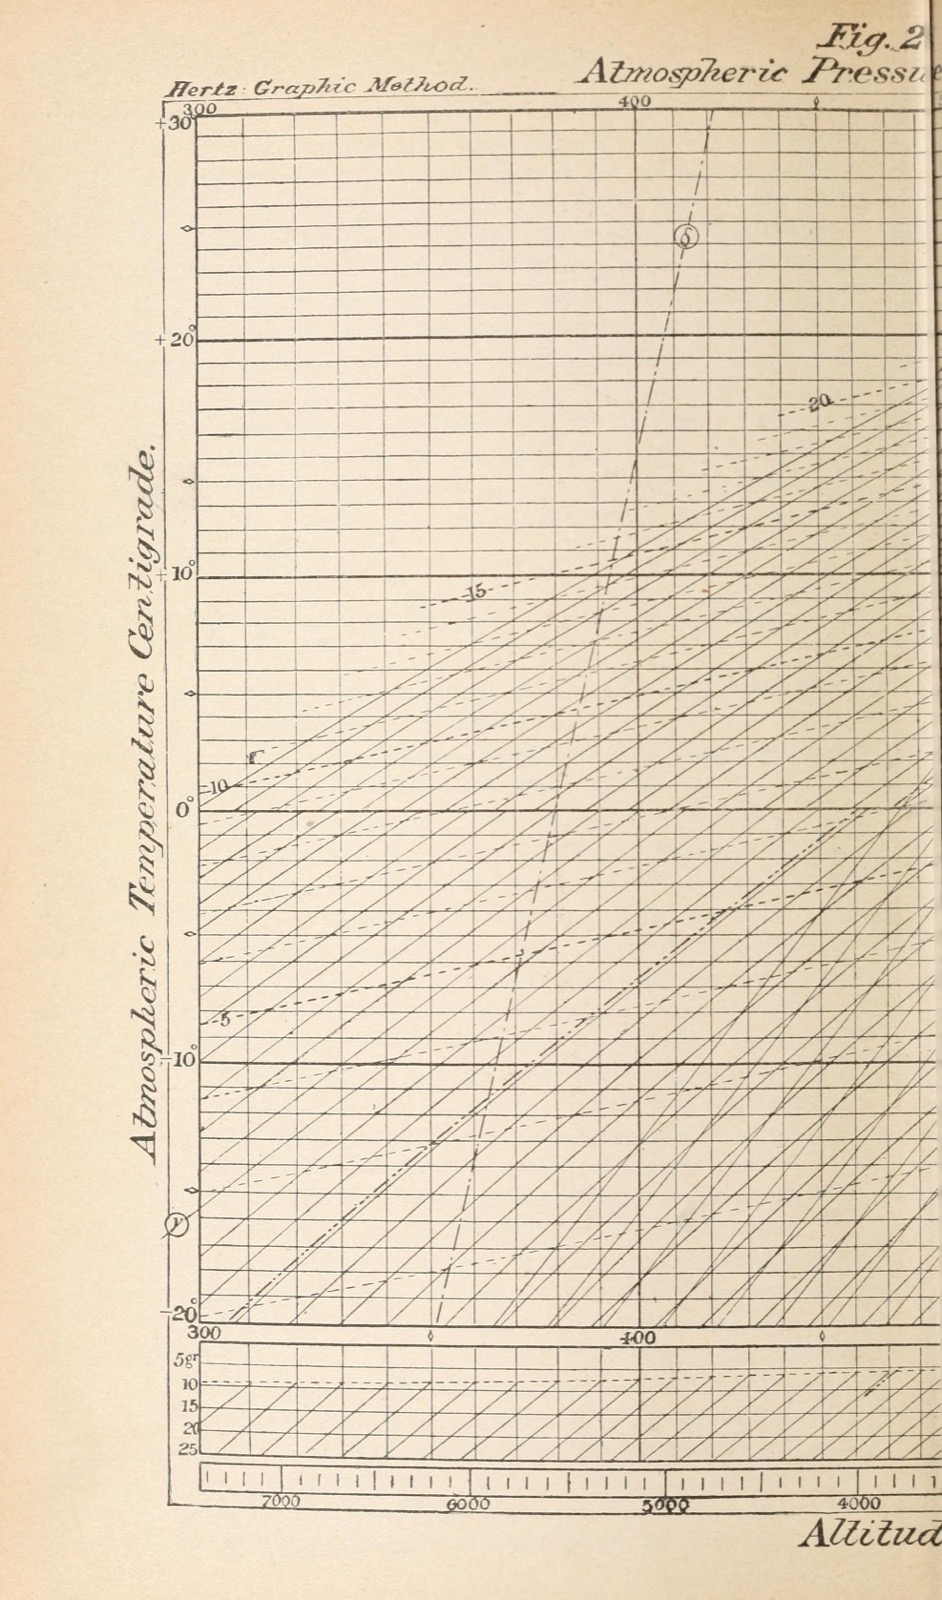
See the original page — Fig. 28, folding plate between pp. 201 and 203 (archive leaves n209, left half, and n210, right half)
Published 1884/1891 (A) and both Hertz (1894) and Abbe (1916) died long before 1955 (B ended 1986 at the latest).
The data it needs
pressureposition · quantitative · mm Hgtemperatureposition · quantitative · degCwater_totalparameter · quantitative · g/kgstagederived regime · categorical · four named stages
Built in 6 steps, as its maker described
paper XIV, pp. 198-211; folding plate Fig. 28
18 other forms share this skeleton
Source
Attribution checked against the source