Studied from its original page
Isobaric-isosteric unit-tubes (solenoid count)
equipotential-isopycnic unit-tubes (the companion pair of families) · unit-parallelograms
- Made by
- V. Bjerknes and J. W. Sandstrom
- Year
- 1910
- Field
- Meteorology and climate
- Kind
- Computing chart
- Room
- Values across a surface
What it shows
Two families of lines over a slice of the atmosphere, spaced so that every small cell where they cross stands for the same amount.
How it is read
Count the cells between two verticals, adding or subtracting each by the direction you go round: the count says how far the air is from balance.
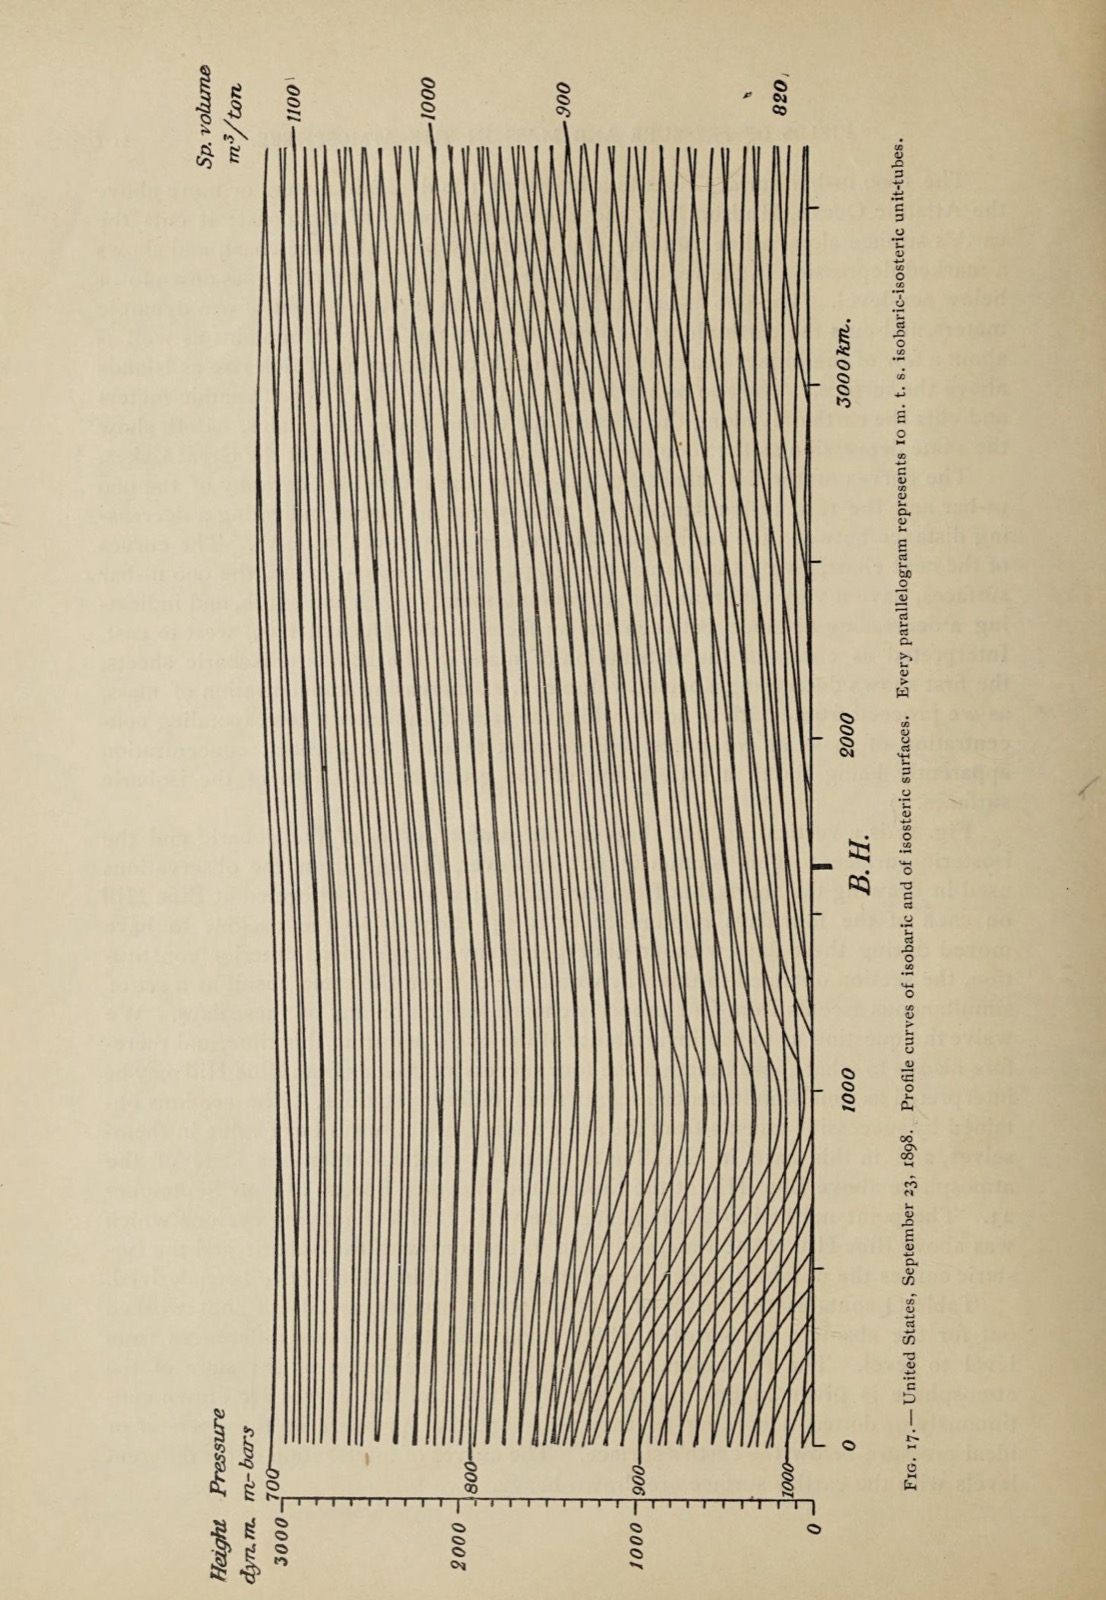
See the original page — Fig. 17, full-page figure on unnumbered p. [102] (archive leaf n111)
Published 1910 (A) and both authors of Part I died before 1955 (Bjerknes 1951, Sandstrom 1947; B ended 2021 at the latest).
The data it needs
xposition · quantitative · kmzposition · quantitative · dyn mfield_avalue · quantitative · c-bar (pressure)field_bvalue · quantitative · m3/ton (specific volume)
Built in 5 steps, as its maker described
section 72 'Unit-Tubes', pp. 120-121; section 73, pp. 121-122; Figs. 17, 18, 21, 24
121 other forms share this skeleton
Source
Bjerknes and Sandström 1910, Dynamic Meteorology and Hydrography
Attribution checked against the source