Room
Values across a surface
One value at every point of a plane that is not a map: a slice of air, a sheet of metal, a pair of measurements. The forms here show how it rises and falls across the plane.
Studied from its original page 3
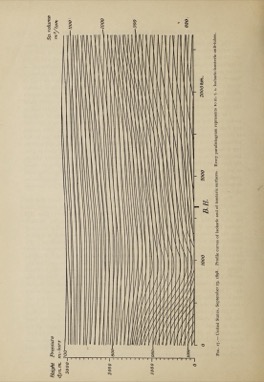
Isobaric-isosteric unit-tubes (solenoid count)
V. Bjerknes and J. W. Sandstrom · 1910
Two families of lines over a slice of the atmosphere, spaced so that every small cell where they cross stands for the same amount.
Slotted interlocking-card surface model
E. S. Farwell (data), via the American Machinist; described by Willard C. Brinton · by 1914
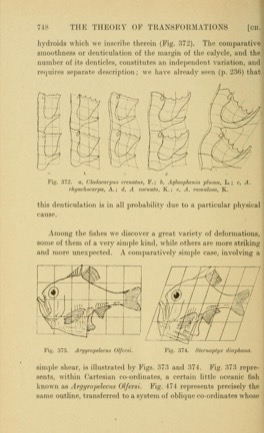
Transformation grids
D'Arcy W. Thompson · 1917
Catalogued 41
- Luoshu and Hetu diagrams Anonymous; named and paired by Song scholars · 1st century CE - 12th century
- Smoke and thread flow visualization Leonardo da Vinci and later experimenters · 1500
- Chladni figures Ernst Florens Friedrich Chladni · 1787
- Jacquard punched cards Joseph Marie Jacquard · 1804
- Lines of force diagram Michael Faraday · 1852
- Zsigmondy-Palmer dental grid Adolf Zsigmondy; modified by Corydon Palmer · 1861
- Stress trajectory diagram Karl Culmann (drawn); James Clerk Maxwell (photoelastic) · 1866
- Gibbs thermodynamic surface Josiah Willard Gibbs · 1873
- Semi-graphic table Toussaint Loua · 1873
- Maxwell thermodynamic surface model James Clerk Maxwell, after James Thomson · 1874
- Thurston glyptic model Robert Henry Thurston · 1875
- Phase portrait and direction field Henri Poincaré · 1881
- Compressor map Turbomachinery testing practice; no single originator · 1900s
- Linear responsibility chart No single originator documented · 20th century
- Turbine hill chart Hydraulic turbine testing practice; no single originator · 1900s
- Butterfly diagram E. Walter Maunder · 1904
- Munsell colour system Albert Henry Munsell · 1905-1915
- Brodmann cytoarchitectonic map Korbinian Brodmann · 1909
- Solid plaster surface model Described by Willard Cope Brinton · 1914
- Cardinal vowel quadrilateral Daniel Jones · 1917
- Axonometric chart John B. Peddle; described by Karsten · 1923
- Orthographic chart Karsten (naming); statistical practice · 1923
- Flow net Philipp Forchheimer (concept); Arthur Casagrande (construction rules) · 1930-1937
- Adaptive landscape Sewall Wright · 1932
- Power-demand relief model Detroit Edison Company · 1935
- Scalogram board Louis Guttman; E.A. Suchman · 1944/1950
- Chart of the nuclides (Segrè chart) Emilio Segrè (popularised); Kurt Guggenheimer (1934 form) · 1945
- Electron-density contour stack Dorothy Crowfoot Hodgkin · 1945-1947
- Visual field chart Hans Goldmann · 1945
- Sound spectrogram Walter Koenig, Harold Dunn and Lawrence Lacy, Bell Telephone Laboratories · 1946
- Hovmöller diagram Ernest Hovmöller · 1949
- Microtiter plate Gyula Takatsy · 1951
- Repertory grid George Kelly · 1955
- Interpersonal circumplex Timothy Leary · 1957
- Forest of rods protein model John Cowdery Kendrew · 1960
- Porkchop plot JPL mission design practice · 1960s
- Three-dimensional spectrogram model Fritz Winckel · 1960
- Energy-maneuverability diagram John Boyd with Thomas P. Christie · 1966
- Reorderable matrix Jacques Bertin · 1967/1977
- Ekistic grid Constantinos Apostolou Doxiadis · 1968
- Median polish John Wilder Tukey · 1977
Could also hang in: Values across a surface 55
- Dunhuang star atlas Tang dynasty China; maker unknown · 700
- Byrhtferth diagram Byrhtferth of Ramsey · 1011
- Weaving draft and drawdown Weaving practice; no single originator · 1600s-1800s
- Ship lines plan Shipbuilding practice; systematised by Fredrik Henrik af Chapman · 18th century
- Table of affinities Étienne François Geoffroy · 1718
- Tonnetz Leonhard Euler · 1739
- Mayer colour triangle Tobias Mayer · 1758
- Lambert colour pyramid Johann Heinrich Lambert with Benjamin Calau · 1772
- Map of plant affinities Paul D. Giseke · 1792
- Printed coordinate (squared) paper Buxton (patent) · 1794
- Argand diagram Jean-Robert Argand (Caspar Wessel independently, 1799) · 1806
- Runge colour sphere Philipp Otto Runge · 1810
- Stereoscope Charles Wheatstone · 1833
- Olivier string models Theodore Olivier · 1839-1853
- Isopleth (contour computing) chart Léon Lalanne; later widespread · 1843-1900
- Telluric screw (vis tellurique) A.-E. B. de Chancourtois · 1862
- Law of octaves table John Alexander Reina Newlands · 1865
- Hinrichs spiral periodic system Gustavus Detlef Hinrichs · 1867
- Mendeleev periodic table Dmitri Ivanovich Mendeleev · 1869
- Baumhauer spiral periodic system Heinrich Adolph Baumhauer · 1870
- Mathematical plaster model Felix Klein's Goettingen school; models by Adolf Weiler and others · 1880
- Bayley pyramid periodic table Thomas Bayley · 1882
- Crookes lemniscate periodic system William Crookes · 1888
- Crookes vis generatrix model William Crookes, built by Gardiner · 1898
- Crum Brown mathematical surface Alexander Crum Brown · 1900
- Isometric graph paper Various, after Farish · 1900s
- Vectorcardiogram Hubert Mann (1920 concept); Ernest Frank (1956 lead system) · 1920-1956
- Janet left-step periodic table Charles Janet · 1928
- CIE 1931 chromaticity diagram Commission Internationale de l'Eclairage, from Wright and Guild experiments · 1931
- Pourbaix (potential-pH) diagram Marcel Pourbaix · 1938
- Stedman three-dimensional periodic table Donald Stedman, National Research Council of Canada · 1940s
- Actinide-series table Glenn Theodore Seaborg · 1945
- Holdridge life-zone diagram Leslie Holdridge · 1947
- Van Krevelen diagram D.W. van Krevelen · 1950
- December 1952 Earle Brown · 1952
- Formant chart Gordon Edward Peterson and Harold Leonard Barney · 1952
- Veitch chart Edward Westbrook Veitch · 1952
- Bioclimatic chart Victor Olgyay · 1953/1963
- Dalitz plot Richard Dalitz · 1953
- Karnaugh map Maurice Karnaugh · 1953
- Johari window Joseph Luft and Harrington Ingham · 1955
- Structure of Intellect cube Joy Paul Guilford · 1955-1956
- Kamb contouring William Barclay Kamb · 1959
- From-to chart (cross chart) Richard Muther (standard citation; originator undocumented) · 1961
- MDS perceptual map Roger Newland Shepard (1962); Joseph Bernard Kruskal (1964) · 1962-1964
- Benfey spiral periodic table Otto Theodor Benfey · 1964
- Dot-matrix sequence comparison Gibbs & McIntyre · 1970
- GE-McKinsey nine-box matrix McKinsey and Company for General Electric; no individual documented · 1970s
- Growth-share matrix Bruce Doolin Henderson; first sketch credited to Alan Zakon · 1970
- House of quality Mitsubishi Heavy Industries Kobe Shipyard; Yoji Akao (QFD) · 1972
- Correspondence analysis map Jean-Paul Benzecri · 1973
- Weathervane plot Attribution unverified · 1974
- Whittaker biome diagram Robert Harding Whittaker · 1975
- Association plot Ayala Cohen; extended by Michael Friendly · 1980
- Plutchik wheel of emotions Robert Plutchik · 1980