Redrawn by us
Diagramme planétaire
- Made by
- Émile Cheysson, Ministère des Travaux publics (Album de statistique graphique)
- Year
- 1897
- Field
- Statistics
- Kind
- Data display
- Room
- Change over time — Placed by reading its description, not yet studiedCould also hang in: Parts of a whole
What it shows
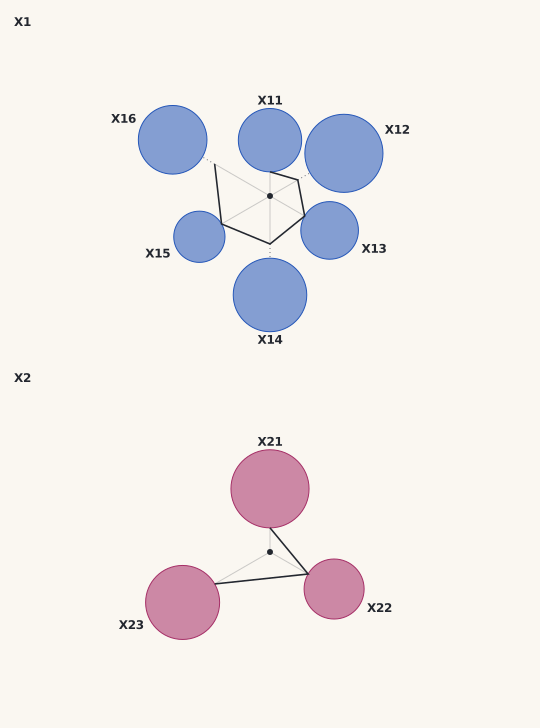
Goods moved in France: one ray per four-year period around a hub, with circles sized by tonnage set along a spiral.
How it is read
Go round the hub period by period and compare the circles' areas; the spiral's radius grows with the length of the network.
What we kept from the original
The hub, the spiral, the discs sized by area and set tangent to it, and the declared outer curve for discs too large to fit.
What we changed
Cheysson's rays were four-year periods and his spiral carried network length; ours are the sub-groups of one group, and the spiral carries their middle value, so it is ordered by value, not by time.
3 other forms share this skeleton
Source
Album de statistique graphique 1895-96, plate issued 1897
Attribution checked against the source