Room
Parts of a whole
Parts that add up to a total, or factors that multiply to one. The forms here show each part's share.
Studied from its original page 9
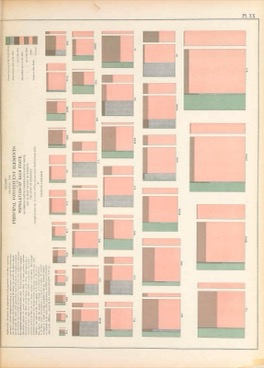
Area-proportional nested population square with external companion
Francis A. Walker · 1874
Each place's population as a square whose area is its size, cut into its parts, with a separate bar for those born there who live elsewhere.
Three-variable rectangle glyph
Jacques Bertillon, Service de la Statistique Municipale de Paris · 1891
Balance (counter-poise) chart
Irving Fisher; two-factor elaboration by Karsten 1923 · 1911
Factorial 100% triangle
Karl G. Karsten (proposed: 'apparently never been used', p. 593) · 1923
Sky-line chart
Karsten (naming); American statistical practice · 1923
IBM Cosmograph
International Business Machines · by 1939
Nested-zone dot circles
Travelers Insurance Co., Hartford · by 1939
Piper trilinear diagram
Arthur M. Piper · 1944
Stiff diagram
H.A. Stiff Jr. · 1951
Catalogued 46
- Merdiban (staircase) accounting layout Abdullah b. Muhammad b. Kiya al-Mazandarani · 1363
- Khipu (quipu) Inca administrators · c.1400-1532
- Newton colour circle Isaac Newton · 1704
- Mayer colour triangle Tobias Mayer · 1758
- Harris colour wheel Moses Harris · 1766
- Lambert colour pyramid Johann Heinrich Lambert with Benjamin Calau · 1772
- Trilinear (ternary) graph paper Various, after Gibbs and Roozeboom · 1800s
- Dalton atomic symbols John Dalton · 1808
- Runge colour sphere Philipp Otto Runge · 1810
- Minard's tableau figuratif (variable-width bars) Charles Joseph Minard · 1844
- Maxwell colour triangle James Clerk Maxwell · 1855-1860
- Gibbs triangle (ternary diagram) J. Willard Gibbs · 1876
- Von Mayr rectangular (proto-mosaic) diagrams Georg von Mayr · 1877
- Cheysson album diagrams Émile Cheysson · 1879-1900
- Venn diagram John Venn · 1880
- Marquand diagram Allan Marquand · 1881
- Carroll diagram Charles Lutwidge Dodgson (Lewis Carroll) · 1886-1896
- Waterfall (bridge) chart No originator documented; popularised by McKinsey and Company · 20th century
- Yamazumi chart Toyota Production System; no individual originator documented · 20th century
- Punnett square Reginald Crundall Punnett · 1905-1906
- Raunkiær life-form spectrum Christen Christiansen Raunkiær · 1905
- ACF and AKF diagrams Pentti Eelis Eskola · 1915
- Ostwald colour solid Wilhelm Ostwald · 1916
- Du Pont formula chart Du Pont (F.D. Brown) · 1919
- Collins bar diagram W.D. Collins · 1923
- De Finetti diagram Bruno de Finetti · 1926
- CIE 1931 chromaticity diagram Commission Internationale de l'Eclairage, from Wright and Guild experiments · 1931
- Maucha star diagram Rezső Maucha · 1932
- Darrow-Yannet diagram Daniel Cady Darrow and Herbert Yannet · 1935
- USDA soil texture triangle United States Department of Agriculture · 1938
- 100% square (area bar chart) Brinton (naming); American statistical practice · 1939
- AFM diagram Lawrence Rickard Wager and William Alexander Deer · 1939
- Hill trilinear water diagram Raymond Allan Hill · 1940
- Gamblegram James L. Gamble · 1942
- Durov diagram S.A. Durov · 1948
- Folk sediment triangle Robert Louis Folk · 1954
- Shepard sediment triangle Francis Parker Shepard · 1954
- Sliding bar chart No single inventor documented; classified by Calvin F. Schmid · 1954
- Johari window Joseph Luft and Harrington Ingham · 1955
- Schoeller semi-log diagram Henri Schoeller · 1955
- Thompson AFM projection James Burleigh Thompson Jr. · 1957
- Pearce-Cann discrimination diagram Julian Andrew Pearce and John Robert Cann · 1973
- QAPF double-triangle diagram Albert Streckeisen · 1976
- Grime CSR triangle John Philip Grime · 1977
- QFL provenance diagram William R. Dickinson and Christopher A. Suczek · 1979
- TAS (total alkali-silica) diagram Maurice John Le Bas, Roger Walter Le Maitre, Albert Streckeisen and Bruno Zanettin · 1986
Could also hang in: Parts of a whole 43
- Ishango bone Upper Palaeolithic maker, Ishango region · 20000 BCE
- Pebble voting Athenian democratic practice · 500 BCE
- Isidore rota diagram Isidore of Seville · 600-625
- Taijitu Zhou Dunyi; Daoist antecedents contested · 1070s
- Exchequer tally stick and chequerboard Exchequer of Henry I, England · 1100-1179
- Euler diagram Leonhard Euler (namesake); earlier forms exist · 1768
- Fourcroy tableau poleometrique Charles de Fourcroy · 1782
- Stanhope square demonstrator Charles Stanhope · c.1805
- Chevreul chromatic circle Michel Eugène Chevreul · 1839
- Great Exhibition gold obelisk Great Exhibition displays, Crystal Palace · 1851
- Pie charts on a map Charles Joseph Minard · 1858
- Polar area diagram (coxcomb) Florence Nightingale · 1858
- Baseball box score Henry Chadwick · 1859
- Thurston glyptic model Robert Henry Thurston · 1875
- Winogradsky column Sergei Nikolaievich Winogradsky · 1880
- Edgeworth box Francis Ysidro Edgeworth; boxed form from Pareto and Bowley · 1881
- Roozeboom ternary phase diagram Hendrik Willem Bakhuis Roozeboom · 1894
- Diagramme planétaire Émile Cheysson, Ministère des Travaux publics (Album de statistique graphique) · 1897
- Sankey diagram Matthew Henry Phineas Riall Sankey · 1898
- Pie hydrochemical diagram Hydrogeology practice; no single originator · 1900s
- Munsell colour system Albert Henry Munsell · 1905-1915
- Jänecke projection Erich Jänecke · 1906
- Pollen diagram Lennart von Post · 1916
- Staircased band chart Karsten (naming); American statistical practice · 1923
- Karsten tridimensional chart Karl G. Karsten · 1926
- Ecological pyramid Charles Elton · 1927
- Histomap John B. Sparks · 1931
- Muller plot Hermann Joseph Muller · 1932
- Pareto chart Joseph Moses Juran · 1941-1951
- Trophic-dynamic diagram Raymond Laurel Lindeman · 1942
- Lund-Browder chart Lund & Browder · 1944
- Rule of nines Pulaski and Tennison (1947); published by Alexander Burns Wallace (1951) · 1947-1951
- Strata (silhouette) chart No single inventor documented; classified by Calvin F. Schmid · 1954
- Silver Springs energy-flow diagram Howard Thomas Odum · 1957
- Swingometer Peter Milne; refined by David Butler and Robert McKenzie · 1959
- Ekistic grid Constantinos Apostolou Doxiadis · 1968
- Gibbs water-chemistry diagram Ronald J. Gibbs · 1970
- Layered three-dimensional Sankey diagram Center for Strategic and International Studies · 1970s
- Participatory ballot-box bar chart Hans Haacke · 1970
- Nassi-Shneiderman diagram Isaac Nassi and Ben Shneiderman · 1973
- Median polish John Wilder Tukey · 1977
- Sieve diagram Riedwyl & Schüpbach · 1983
- Fourfold display Michael Friendly · 1994