Room
Places
Values that belong to places on the earth: towns, regions, routes. The forms here put each value where it happened.
Studied from its original page 1
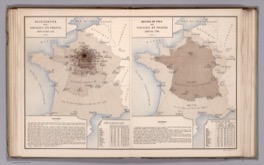
Radial anamorphosis of travel time
Ministère des Travaux Publics (Album de statistique graphique, directed by Émile Cheysson) · 1888
France drawn six times over, each outline stretched along every line from Paris to a city by how long that journey took in one era.
Catalogued 134
- Abauntz engraved stone map Unknown; identified by Pilar Utrilla and colleagues · 13660 BP
- Catalhoyuk town plan Unknown · 6200 BCE
- Hipparchus magnitude star catalogue Hipparchus of Nicaea · 134 BCE
- Ptolemaic graticule Claudius Ptolemy · 90-150
- Macrobian zonal map Ambrosius Theodosius Macrobius; surviving copies medieval · 400
- T-O map Isidore of Seville (scheme) · 7th-8th century
- Dunhuang star atlas Tang dynasty China; maker unknown · 700
- Book of Curiosities rectangular world map Anonymous, Fatimid Egypt · 1020-1050
- Kâşgarlı Mahmud world map Kâşgarlı Mahmud (Mahmud al-Kashgari) · 1072-1074
- Yu Ji Tu grid map Song dynasty China; carver unknown · 1136
- Catalan Atlas Abraham Cresques · 1375
- Cheonsang Yeolcha Bunyajido Royal astronomers of King Taejo of Joseon · 1395
- Borgia map Unknown; engraved on metal, now in the Vatican · 1430
- Plan-relief French military engineering; notably Sebastien Le Prestre de Vauban · 1500s-1700s
- Relief shading (hill shading) Gradual; theorised by Eduard Imhof · 1500s-1900s
- Matrakçı Nasuh itinerary views Matrakçı Nasuh · 1537
- Anatomical flap sheet Heinrich Vogtherr the Elder; later Vesalius · 1538
- Bayer magnitude lettering Johann Bayer · 1603
- Le Nautonier isogonic map Guillaume Le Nautonier · 1603
- Scheiner sunspot small multiples Christoph Scheiner · 1626
- Strip map John Ogilby; earlier Matthew Paris and the Tabula Peutingeriana · 1675
- Halley trade-wind chart Edmond Halley · 1686
- Ship lines plan Shipbuilding practice; systematised by Fredrik Henrik af Chapman · 18th century
- Isogonic chart Edmond Halley · 1701
- Eclipse path map Edmond Halley · 1715
- Geological cross-section John Strachey (earliest known); developed by William Smith · 1719
- Bathymetric contour chart Nicolaas Samuel Cruquius · 1729
- Chorochromatic map Gradual; term associated with Erwin Raisz · 1741-1938
- Nolli figure-ground plan Giambattista Nolli · 1748
- Buache contour map Philippe Buache · 1752
- Charpentier geological map Johann Friedrich Wilhelm von Charpentier · 1778
- Crome's area comparisons August F.W. Crome · 1782/1785
- Du Carla theoretical contour map Marcellin du Carla-Boniface · 1782
- Pin map Valentine Seaman (earliest claimed dot map); pin practice later · 1797
- Hachures Johann Georg Lehmann · 1799
- Gnomonic great-circle chart Navigational practice; projection attributed to antiquity · 1800s
- Isohyet map Various, after Humboldt · 1800s
- Playfair's circle diagrams with tangent lines William Playfair · 1801
- Geological map William Smith · 1815
- Humboldt isotherm map Alexander von Humboldt · 1817
- Brandes synoptic weather chart Heinrich Wilhelm Brandes · 1820
- Hypsometric tints Franz von Hauslab (first coloured contours); Bartholomew (popularised) · 1820s-1800s
- Papier-mache anatomical model Louis Thomas Jerome Auzoux · 1820
- Isometric projection (Farish) William Farish · 1822
- Dupin's figurative map (first choropleth) Charles Dupin · 1826
- Von Thunen rings Johann Heinrich von Thunen · 1826
- Dot density map Armand Joseph Frère de Montizon · 1830
- Quin historical atlas Edward Quin · 1830
- Cotidal chart William Whewell · 1833
- Guerry moral statistics maps André-Michel Guerry · 1833
- Scrope classed density map George Julius Poulett Scrope · 1833
- Stereoscope Charles Wheatstone · 1833
- Harness proportional-symbol and flow maps Henry D. Harness · 1837
- Physical atlas Heinrich Berghaus · 1838
- Ethnographic map James Cowles Prichard and Alexander Keith Johnston · 1843
- Minard flow map Charles Joseph Minard · 1845-1869
- Wind and current chart (pilot chart) Matthew Fontaine Maury · 1847
- Fletcher moral statistics maps Joseph Fletcher · 1849
- Snow walking-distance boundary John Snow · 1855
- Pie charts on a map Charles Joseph Minard · 1858
- Tissot indicatrix Nicolas Auguste Tissot · 1859
- Isobar map Edme Hippolyte Marie-Davy; Robert FitzRoy · 1860s
- Meteorographica multivariate weather sheet Francis Galton · 1863
- Levasseur area cartogram Pierre Émile Levasseur · 1868-1875
- Electoral map Leon Montigny · 1870
- Structure contour map Benjamin Smith Lyman · 1870
- Population contour (isopleth) map Louis-Leger Vauthier · 1874
- Newspaper weather map Francis Galton (The Times) · 1875
- Isogloss dialect map Georg Wenker; Jules Gilliéron · 1876+
- Block diagram William Morris Davis (technique); Armin Kohl Lobeck (codified) · 1880s-1924
- Isochronic passage chart Francis Galton · 1881
- Scribner Statistical Atlas of the United States Fletcher Willis Hewes and Henry Gannett · 1883
- Ammassalik wooden coastal maps Kunit, Ammassalik Inuit maker · 1885
- Booth poverty map Charles Booth · 1889
- Outlook Tower regional survey Patrick Geddes · 1892
- Dermatome map Henry Head; Otfrid Foerster; Jay Keegan and Frederic Garrett · 1893-1948
- Football play diagram Amos Alonzo Stagg and Henry Lawrence Williams · 1893
- Hull-House nationality and wage maps Florence Kelley and the Hull-House residents · 1895
- Bivariate map Jacques Bertillon · 1896
- Mechanical teaching map James Ives · 1896
- Marshall Islands stick chart Marshallese navigators · pre-1900
- Cricket wagon wheel Cricket scoring practice; no single originator · 1900s
- Defect concentration diagram Quality engineering practice; no single originator · 1900s
- Fence (panel) diagram Subsurface geology practice; no single originator · 1900s
- Isometric graph paper Various, after Farish · 1900s
- Pie hydrochemical diagram Hydrogeology practice; no single originator · 1900s
- Spaghetti diagram No single inventor documented; industrial engineering practice · 20th century
- Station model International meteorological practice · 1900s-1920s
- Wind barb International meteorological practice · 1900s
- Weber location triangle Alfred Weber · 1909
- Apportionment cartogram US House apportionment publications · 1911
- Dasymetric map Benjamin Semyonov-Tian-Shansky (term); John Kirtland Wright (Western practice) · 1911-1936
- Thiessen polygons A.H. Thiessen · 1911
- Cyclegraph / chronocyclegraph Frank & Lillian Gilbreth · 1913-1917
- Bead map American sales and statistical practice; described by Brinton and Karsten · 1914-1923
- Routing string map American sales practice; described by Brinton and Karsten · 1914-1923
- Phenological isochrone map Andrew Delmar Hopkins · 1918
- Bergen frontal symbols Jacob Bjerknes and the Bergen School · 1919
- Isopach map American petroleum geology practice; no single originator · 1920s
- Focal mechanism (beachball) diagram Hidezo Nakano (method); Perry Byerly (teleseismic solutions) · 1923-1928
- Karsten population-projection cartogram Karl G. Karsten · 1923
- Stick (tree) map American sales practice; described by Karsten · 1923
- Concentric zone model Ernest Watson Burgess · 1925
- Fate map Walther Vogt · 1929
- Physiographic diagram Erwin Josephus Raisz · 1931
- Central place hexagons Walter Christaller · 1933
- Forest profile diagram Thomas Albert Warren Davis and Paul Westmacott Richards · 1933
- Corporate relief globe Ford Motor Company, Chicago World's Fair · 1934
- Planetarium lunar surface model Roger Hayward for the Griffith Observatory · 1934
- Rectangular statistical cartogram Erwin Raisz · 1934
- Cortical homunculus Wilder Penfield · 1937
- String diagram (method study) No single originator documented; motion-study tradition · 1937
- Hoyt sector model Homer Hoyt · 1939
- Orange-peel (gore) map Brinton (naming); globe-making practice · 1939
- Ship-model trade map British pavilion, New York World's Fair · 1939
- Statistical relief map American statistical practice; described by Brinton · 1939
- Storm track map Insurance and weather-service practice; reproduced by Brinton · 1939
- Dowding system plotting table Hugh Dowding with Henry Tizard and Patrick Blackett · 1940
- Traffic flow profile relief map US Public Roads Administration · 1941
- Dymaxion map and folding globe Richard Buckminster Fuller · 1943
- Lund-Browder chart Lund & Browder · 1944
- Multiple nuclei model Chauncy Dennison Harris and Edward Louis Ullman · 1945
- Rule of nines Pulaski and Tennison (1947); published by Alexander Burns Wallace (1951) · 1947-1951
- Mississippi River Basin Model US Army Corps of Engineers · 1949
- Pain drawing Harold Palmer · 1949
- Illuminated (Tanaka) contours Kitirô Tanaka · 1950
- Karyotype ideogram Cytogenetics practice after Joe Hin Tjio and Albert Levan · 1956-1960s
- San Francisco Bay Model US Army Corps of Engineers · 1957
- Desire line map Chicago Area Transportation Study; no single originator · 1959
- Mental-map notation Kevin Lynch · 1960
- Globus IMP navigation indicator Soviet spacecraft instrumentation · 1961
- Serial vision Gordon Cullen · 1961
- Gould-White mental map Peter Gould and Rodney White · 1974
- Isovist Michael Benedikt · 1979
Could also hang in: Places 29
- Houfeng didong yi (Zhang Heng seismoscope) Zhang Heng · 132
- Astrolabe Nastulus (earliest dated instrument); Hellenistic theoretical origin · 927-928 (earliest dated survivor)
- Guidonian hand Guido of Arezzo (attributed); drawn form from the 12th century · 1025-1200
- Liber Floridus diagrams Lambert of Saint-Omer · 1120
- Smoke and thread flow visualization Leonardo da Vinci and later experimenters · 1500
- Codex Mendoza tribute list Nahua tlacuilo scribes at Tlatelolco, for Viceroy Antonio de Mendoza · 1541
- Traverse board Traditional nautical practice; no single originator · 1571 or earlier
- Sunspot drawing sequence Galileo Galilei · 1613
- Beauchamp-Feuillet notation Pierre Beauchamp (system); Raoul-Auger Feuillet (published) · 1700
- Orrery John Rowley, on George Graham's mechanism · 1712-1713
- Descriptive geometry (Monge projections) Gaspard Monge · 1799
- Sumner line Thomas Hubbard Sumner · 1837
- Visible Speech notation Alexander Melville Bell · 1867
- Wave model (Wellentheorie) Johannes Schmidt · 1872
- Cheysson album diagrams Émile Cheysson · 1879-1900
- Galton number form Francis Galton · 1880-1881
- Sun-path diagram Various; popularised by Victor Olgyay · 1900s
- Genetic linkage map Alfred Henry Sturtevant · 1913
- Wire motion-path model Frank Bunker Gilbreth · 1915
- Cardinal vowel quadrilateral Daniel Jones · 1917
- Life space diagram Kurt Lewin · 1936
- Depth-area-duration curves US Weather Bureau and Corps of Engineers practice; no single originator · 1940s
- Visual field chart Hans Goldmann · 1945
- Shading mask protractor Victor Olgyay and Aladár Olgyay · 1957
- Pollution rose Air pollution meteorology practice · 1960s
- Motation Lawrence Halprin · 1965
- Graphical rational patterns Roberto Bachi · 1968
- Space-time aquarium Torsten Hägerstrand · 1970
- Axial map and justified graph Bill Hillier and Julienne Hanson · 1984