Redrawn by us
Stanhope square demonstrator
- Made by
- Charles Stanhope
- Year
- c.1805
- Field
- Logic, language and computing
- Kind
- Physical object
- Room
- Charts that compute — Placed by reading its description, not yet studiedCould also hang in: Parts of a whole
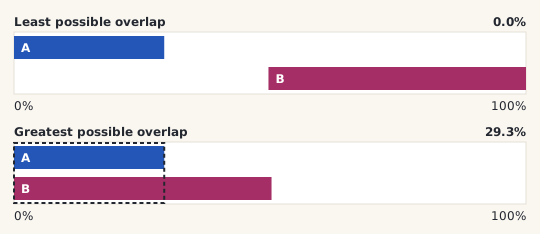
What we kept from the original
Two strips slid across one whole, read by how much of them must overlap.
What we changed
Stanhope's demonstrator was an instrument for teaching logic; ours is a drawing for two event frequencies, and it marks the most overlap they allow as well as the least.
55 other forms share this skeleton
Source
Science Museum Group collection, object 1953-353
Attribution less certain: contested, or no single inventor recorded